. 2013 Jan 17;152(1-2):352-64.
doi: 10.1016/j.cell.2012.10.054. Epub 2013 Jan 11.

Comprehensive analysis of silencing mutants reveals complex regulation of the Arabidopsis methylome

Affiliations

Comprehensive analysis of silencing mutants reveals complex regulation of the Arabidopsis methylome

Hume Stroud et al. Cell. .

Erratum in

  • Cell. 2015 Jun 18;161(7):1697-8

Abstract

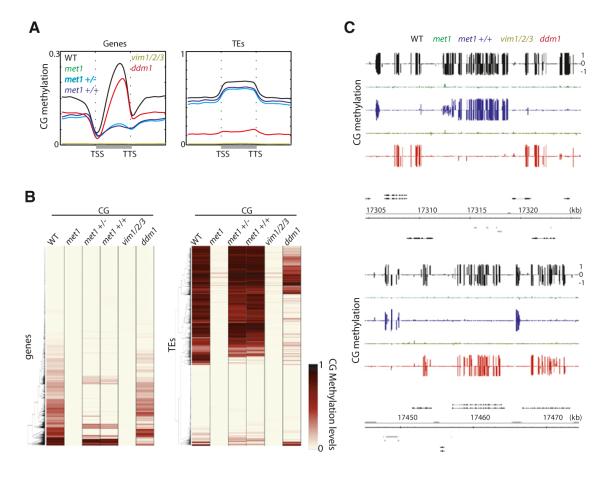
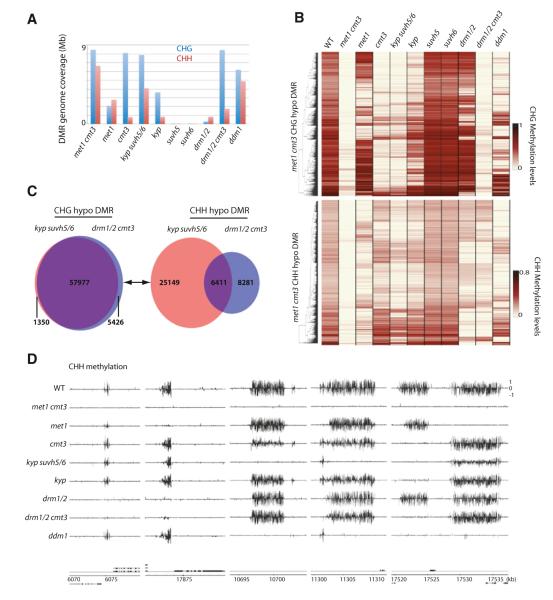
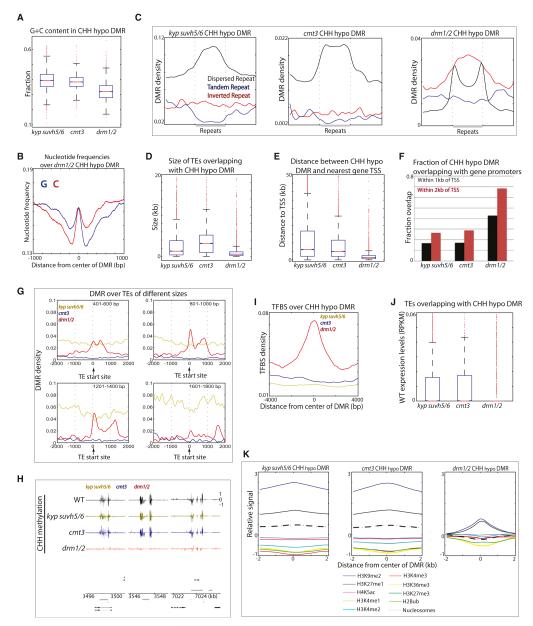
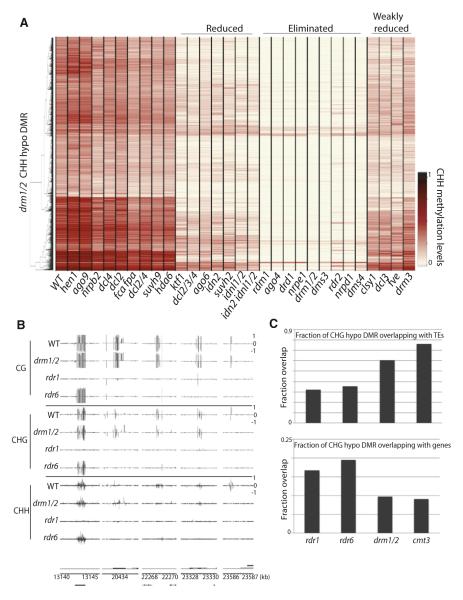
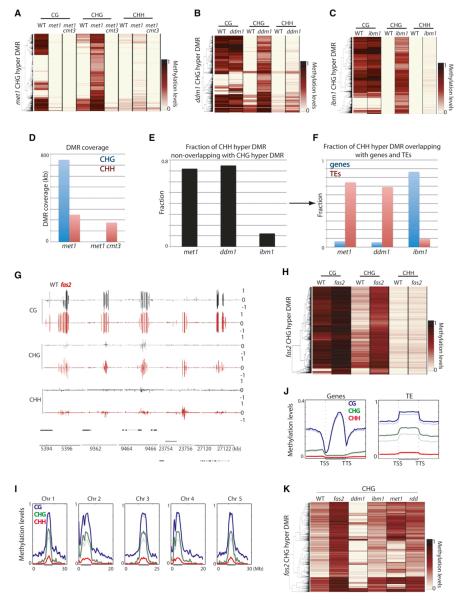
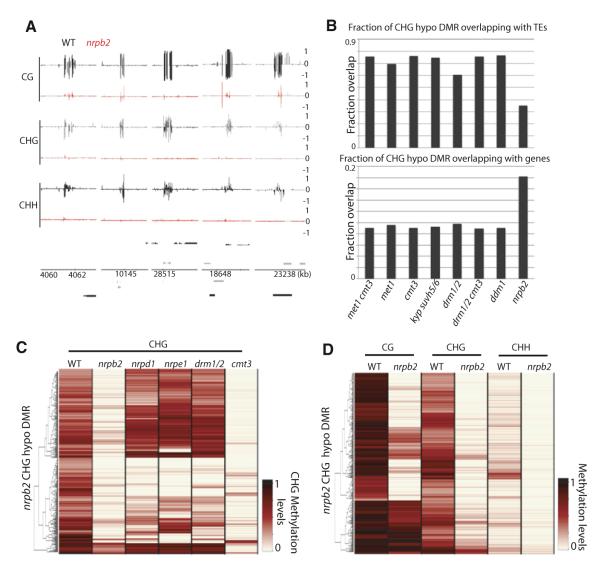
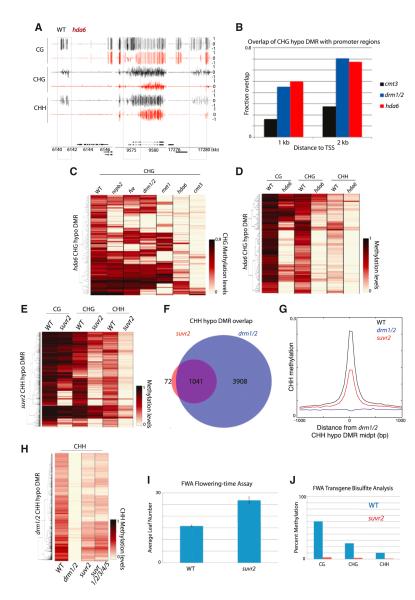
Cytosine methylation is involved in various biological processes such as silencing of transposable elements (TEs) and imprinting. Multiple pathways regulate DNA methylation in different sequence contexts, but the factors that regulate DNA methylation at a given site in the genome largely remain unknown. Here we have surveyed the methylomes of a comprehensive list of 86 Arabidopsis gene silencing mutants by generating single-nucleotide resolution maps of DNA methylation. We find that DNA methylation is site specifically regulated by different factors. Furthermore, we have identified additional regulators of DNA methylation. These data and analyses will serve as a comprehensive community resource for further understanding the control of DNA methylation patterning.


Figures

Figure 1
Figure 1. CG Methylation
(A) Average distribution of CG methylation over protein-coding genes (left) and TEs (right). Flanking regions are the same length as the gene or TE body (middle region). TSS = transcription start site. TTS = transcription termination site. (B) Heatmap of CG methylation levels (black, 1; white, 0) within all genes and TEs in chromosome 1. Columns represent data for each indicated genotype, and rows represent the genes/TEs. The rows were sorted by complete linkage hierarchical clustering with Euclidean distance as a distance measure. (C) Genome browser views of CG methylation in chromosome 1. Genes (black bars) and TEs (gray bars) are shown below. See also Figure S1 and Table S1.
Figure 2
Figure 2. Non-CG Methylation
(A) Genome coverage of defined CHG and CHH hypomethylation DMRs. (B) Heatmap of methylation levels within 17,437 met1 cmt3 CHG (top) and 13,776 CHH (bottom) hypomethylation DMRs. (C) Overlap between kyp suvh5/6 and drm1/2 cmt3 hypomethylation DMRs. (D) Genome browser views of CHH methylation in chromosome 1. Genes (black bars) are shown below. See also Figure S2 and Table S1.
Figure 3
Figure 3. Characteristics of CHH Sites Regulated by KYP SUVH5/6, CMT3, and DRM1/2
(A) G+C content ((G+C)/(G+C+A+T)) in CHH hypomethylation DMRs. Red lines, median; edges of boxes, 25th (bottom) and 75th (top) percentiles; error bars, minimum and maximum points within 1.5×IQR (interquartile range); red dots, outliers. (B) Base composition over drm1/2 CHH hypomethylation DMRs. (C) Average distribution of CHH hypomethylation DMRs (DMR per bp) over different repeats. Flanking regions are the same length as the repeat (middle region). (D) Boxplots of sizes of TEs that overlap with CHH hypomethylation DMRs. (E) Boxplots of distances between CHH hypomethylation DMRs and the closest gene TSS. (F) Fraction of CHH hypomethylation DMRs that are within 1 kb or 2 kb from TSS. (G) Average distribution of DMRs over TEs of indicated sizes. Negative x axis scale is outside of TEs, and positive x axis scale is toward the body of TEs. (H) Genome browser views showing loss of methylation spikes at boundaries of TEs in drm1/2 in chromosome 1. Genes (black bars) and TEs (gray bars) are shown below. (I) TFBS (TFBS per bp) over CHH hypomethylation DMRs. (J) Wild-type expression levels of TEs overlapping with CHH hypomethylation DMRs. (K) Average histone modification and nucleosome distributions over CHH hypomethylation DMRs. See also Figure S3 and Table S1.
Figure 4
Figure 4. RNA-Directed DNA Methylation
(A) Heatmap of methylation levels within 4,949 drm1/2 CHH hypomethylation DMRs. Genotypes (columns) have also been clustered. (B) Genome browser views of DNA methylation in chromosome 1. Genes (black bars) are shown below. (C) Overlap of rdr1 and rdr6 CHG hypomethylation DMRs with TEs and genes. See also Figure S4 and Table S1.
Figure 5
Figure 5. Ectopic Hypermethylation
(A) Heatmap of methylation levels within 4,773 met1 CHG hypermethylation DMRs. (B) Heatmap of methylation levels within 2,695 ddm1 CHG hypermethylation DMRs. (C) Heatmap of methylation levels within 13,588 ibm1 CHG hypermethylation DMRs. (D) Genome coverage of defined CHG and CHH hypermethylation DMRs. (E) Fraction of CHH hypermethylation DMRs nonoverlapping with CHG hypermethylation DMRs. (F) Fraction of CHH hypermethylation DMRs nonoverlapping with CHG hypermethylation DMRs that overlap with genes and TEs. (G) Genome browser views of DNA methylation in wild-type and fas2 in chromosome 1. Genes (black bars) and TEs (gray bars) are shown below. (H) Heatmap of methylation levels within 1,572 fas2 CHG hypermethylation DMRs. (I) Chromosomal views of methylation in wild-type (faded lines) and fas2 (solid lines). Regions of pericentromeric heterochromatin are indicated by back bars below the graphs. (J) Average distribution of methylation levels over genes and TEs in wild-type (faded lines) and fas2 (solid lines). Upstream and downstream regions are the same length as the gene/TE (middle region). (K) Heatmap of methylation levels within fas2 CHG hypermethylation DMRs. See also Figure S5 and Table S1.
Figure 6
Figure 6. RNA Pol II-Directed DNA Methylation
(A) Genome browser views of DNA methylation in wild-type and nrpb2 in chromosome 1. Genes (black bars) and TEs (gray bars) are shown below. (B) Fraction of CHG hypomethylation DMRs overlapping with TEs and genes. (C and D) Heatmap of methylation levels within 413 nrpb2 CHG hypomethylation DMRs. See also Table S1.
Figure 7
Figure 7. Chromatin Modifiers Involved in DNA Methylation
(A) Genome browser views of DNA methylation in wild-type and hda6 in chromosome 1. Genes (black bars) are shown below. (B) Fraction of CHG hypomethylation DMRs that are within 1 kb or 2 kb from TSS. (C and D) Heatmap of methylation levels within 120 hda6 CHG hypomethylation DMRs. (E) Heatmap of methylation levels within 1,113 suvr2 CHH hypomethylation DMRs. (F) Overlap between suvr2 and drm1/2 CHH hypomethylation DMRs. (G) Average distribution of CHH methylation over drm1/2 CHH hypomethylation DMRs. (H) Heatmap of methylation levels within 4,949 drm1/2 CHH hypomethylation DMRs. (I) FWA flowering-time assay. Approximately 20 plants were measured in each population. Data are represented as mean ± SEM. (J) FWA transgene bisulfite analysis. DNA methylation of the transgenic copy of FWA in FWA transformed plants was analyzed. See also Figure S6 and Table S1.

References

    1. Aufsatz W, Mette MF, van der Winden J, Matzke M, Matzke AJ. HDA6, a putative histone deacetylase needed to enhance DNA methylation induced by double-stranded RNA. EMBO J. 2002;21:6832–6841. - PMC - PubMed
    1. Ausin I, Mockler TC, Chory J, Jacobsen SE. IDN1 and IDN2 are required for de novo DNA methylation in Arabidopsis thaliana. Nat. Struct. Mol. Biol. 2009;16:1325–1327. - PMC - PubMed
    1. Baumbusch LO, Thorstensen T, Krauss V, Fischer A, Naumann K, Assalkhou R, Schulz I, Reuter G, Aalen RB. The Arabidopsis thaliana genome contains at least 29 active genes encoding SET domain proteins that can be assigned to four evolutionarily conserved classes. Nucleic Acids Res. 2001;29:4319–4333. - PMC - PubMed
    1. Baürle I, Smith L, Baulcombe DC, Dean C. Widespread role for the flowering-time regulators FCA and FPA in RNA-mediated chromatin silencing. Science. 2007;318:109–112. - PubMed
    1. Bernatavichute YV, Zhang X, Cokus S, Pellegrini M, Jacobsen SE. Genome-wide association of histone H3 lysine nine methylation with CHG DNA methylation in Arabidopsis thaliana. PLoS ONE. 2008;3:e3156. - PMC - PubMed

Publication types

Associated data