. 2013 Feb;16(2):210-8.
doi: 10.1038/nn.3305. Epub 2013 Jan 13.

The organization of two new cortical interneuronal circuits

Affiliations

The organization of two new cortical interneuronal circuits

Xiaolong Jiang et al. Nat Neurosci. 2013 Feb.

Erratum in

  • Nat Neurosci. 2013 Dec;16(12):1908

Abstract

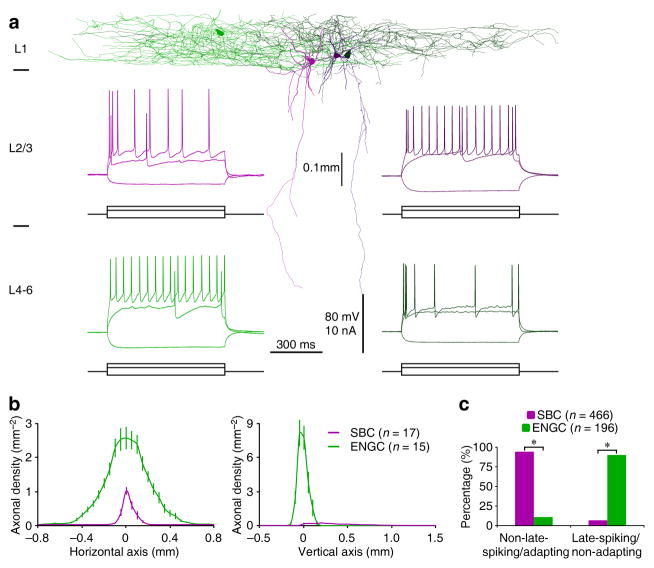
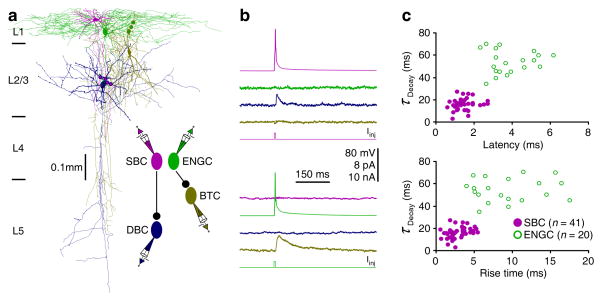
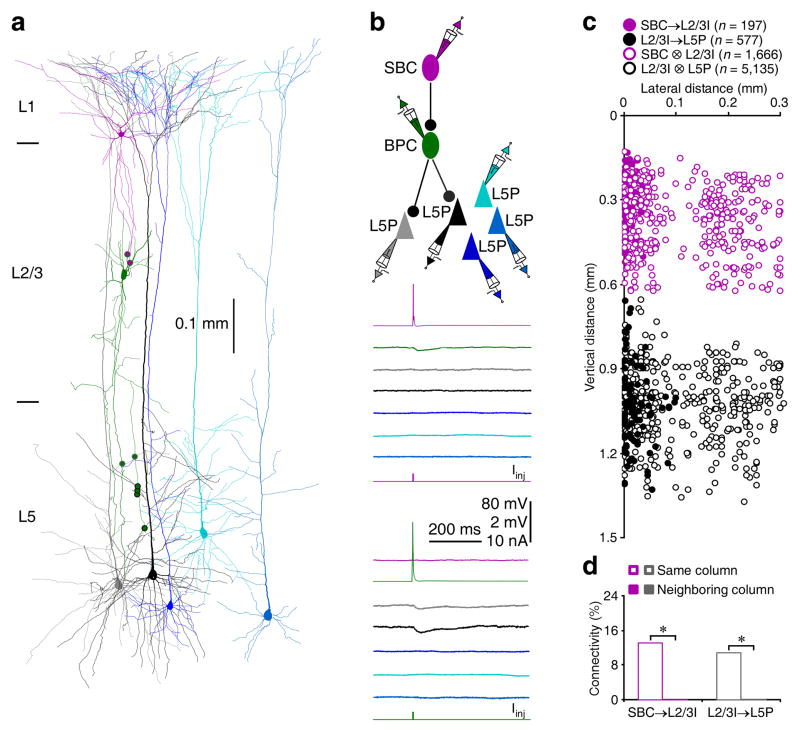
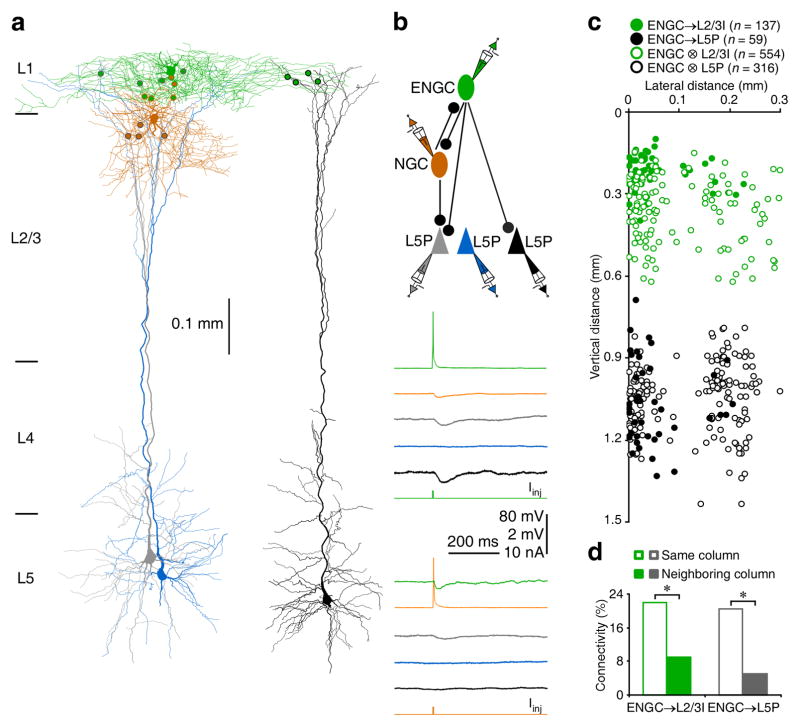
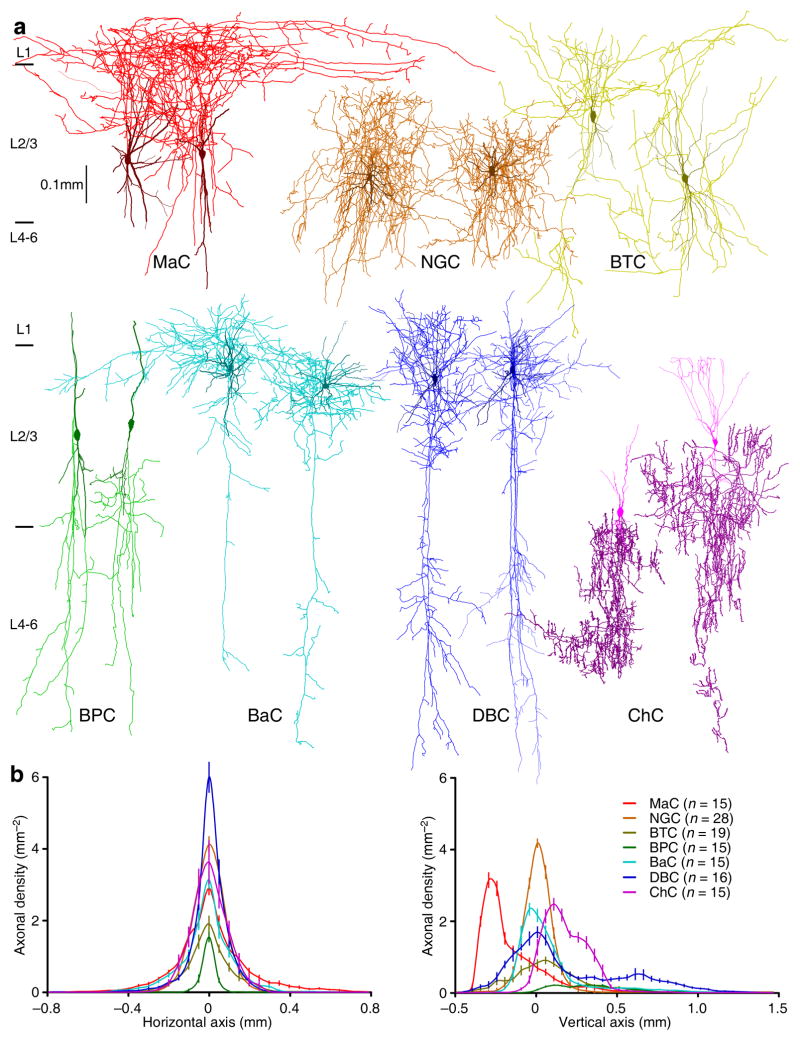
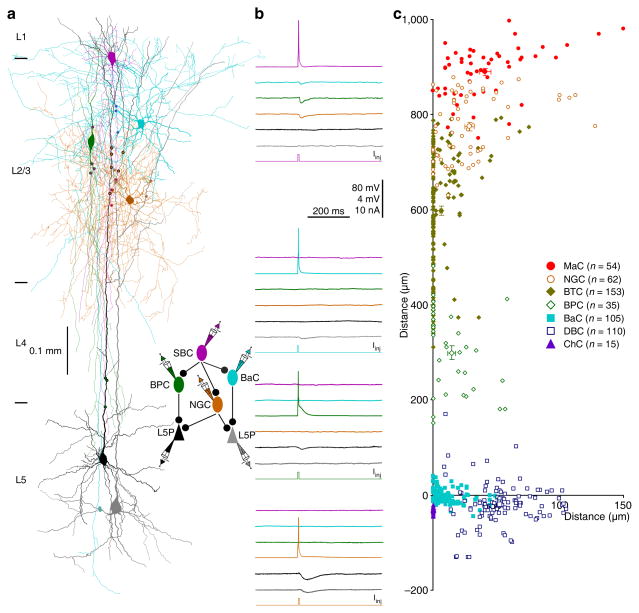
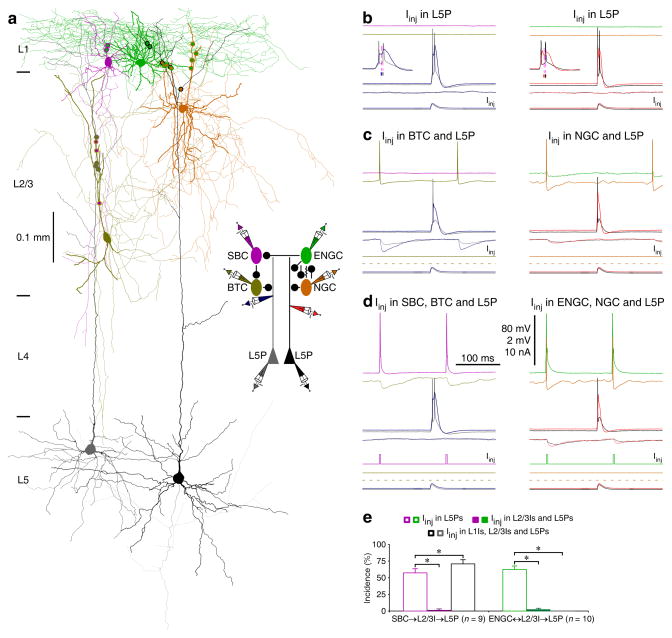
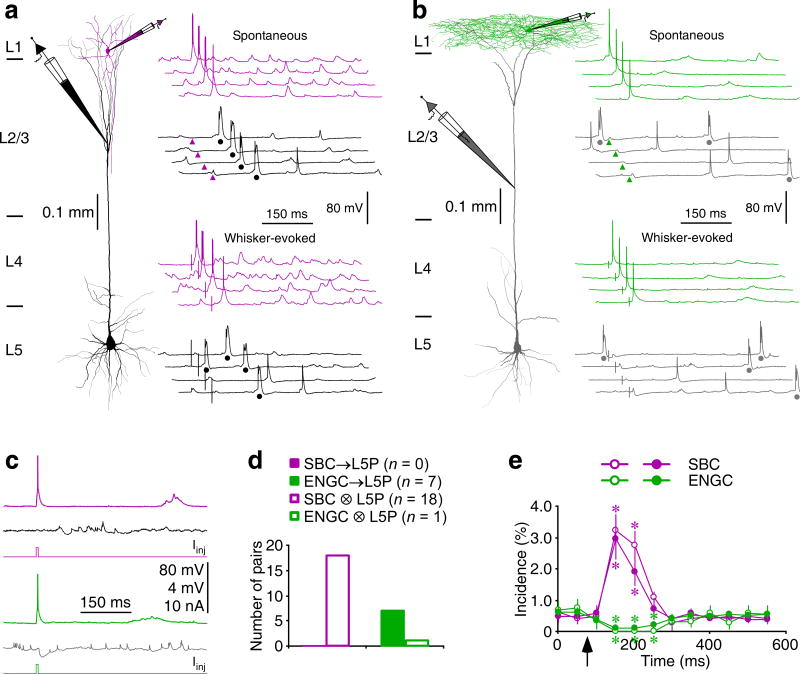
Deciphering the interneuronal circuitry is central to understanding brain functions, yet it remains a challenging task in neurobiology. Using simultaneous quadruple-octuple in vitro and dual in vivo whole-cell recordings, we found two previously unknown interneuronal circuits that link cortical layer 1-3 (L1-3) interneurons and L5 pyramidal neurons in the rat neocortex. L1 single-bouquet cells (SBCs) preferentially formed unidirectional inhibitory connections on L2/3 interneurons that inhibited the entire dendritic-somato-axonal axis of ∼1% of L5 pyramidal neurons located in the same column. In contrast, L1 elongated neurogliaform cells (ENGCs) frequently formed mutual inhibitory and electric connections with L2/3 interneurons, and these L1-3 interneurons inhibited the distal apical dendrite of >60% of L5 pyramidal neurons across multiple columns. Functionally, SBC→L2/3 interneuron→L5 pyramidal neuronal circuits disinhibited and ENGC↔L2/3 interneuron→L5 pyramidal neuronal circuits inhibited the initiation of dendritic complex spikes in L5 pyramidal neurons. As dendritic complex spikes can serve coincidence detection, these cortical interneuronal circuits may be essential for salience selection.


Conflict of interest statement

COMPETING FINANCIAL INTERESTS

The authors declare no competing financial interests.

Figures

Fig. 1
Fig. 1. L1 interneurons SBCs and ENGCs differ in preferential spiking patterns
(a) Reconstruction of two SBCs (pink and dark pink) and two ENGCs (green and dark green) recorded in L1 from acute cortical slices. Note the deeper layer-projecting axons from SBCs and largely L1-restricted axons from ENGCs. Inserted recordings show that one SBC fired typical adapting non-late-spiking (upper left) and the other SBC fired non-adapting late-spiking (upper right), and one ENGC fired typical nonadapting late-spiking (lower left) and the other ENGC fired adapting non-late-spiking (lower right) in response to near- and supra-threshold current injections. Scale bars apply to all recording traces. (b) Axonal length density plots of L1 neurons (SBC: n=17; ENGC: n=15; F=318.9; p<0.001; ANOVA tests). Note the origin of X and Y axes indicating the soma location of interneurons and the positive direction of the vertical axis pointing to the cortical white matter. (c) Histograms indicate that the majority of SBCs displayed adapting non-late-spiking firing pattern (SBC: 94.2%, n=439 of 466 tested; ENGC: 10.7%, n=21 of 196 tested; χ2=456.2) whereas the majority of ENGCs displayed non-adapting late-spiking firing pattern (SBC: 5.8%, n=27 of 466 tested; ENGC: 89.3%, n=175 of 196 tested; χ2=456.2). Asterisks indicate p<0.0005 (Chi-squared tests).
Fig. 2
Fig. 2. L1-3 interneurons form two distinct inhibitory circuits
(a) Reconstruction of L1 SBC (pink), L1 ENGC (green), L2/3 DBC (blue) and L2/3 BTC (yellow) recorded simultaneously from an acute cortical slice. The double colored dots indicate the putative synaptic contacts. The schematic drawing shows symbolically the synaptic connections. (b) Single action potentials elicited in SBC and ENGC evoked uIPSCs in postsynaptic DBC and BTC, respectively. Scale bars apply to all recording traces with 8 pA and 10 nA bars applied to uIPSC and current injection traces, respectively. (c) Plots of the latencies and rise times against decay time constants of SBC- and ENGC-induced uIPSCs in L2/3 interneurons show significant differences in kinetics (Mann-Whitney Rank Sum tests). Values for the latencies (SBC: 1.4±0.1 ms, n=41; ENGC: 3.8±0.3 ms, n=20; U=7.5; p<0.001), rise times (SBC: 3.4±0.2 ms, n=41; ENGC: 9.9±0.9 ms, n=20; U=25; p<0.001), and decay time constants (SBC: 15.7±0.8 ms, n=41; ENGC: 54.8±3.0 ms, n=20; U=31; p<0.05) of SBC- and ENGC-induced uIPSCs.
Fig. 3
Fig. 3. SBCs form inhibitory circuits within single columns
(a) Reconstruction of L1 SBC (pink), L2/3 BPC (dark green), and multiple L5 pyramidal neurons recorded simultaneously from an acute cortical slice. The double colored dots indicate the putative synaptic contacts. (b) Single action potentials elicited in presynaptic SBC and BPC evoked uIPSPs in postsynaptic BPC and two L5 pyramidal neurons (grey and black), respectively. The above schematic drawing shows symbolically the synaptic connections. Scale bars apply to all recording traces with 80 mV and 2 mV bars applied to traces with and without action potentials, respectively. (c) The plot shows the relative position of L2/3 interneurons and L5 pyramidal neurons to SBCs and connectivity between SBCs and L2/3 interneurons or L2/3 interneurons and L5 pyramidal neurons in the same and neighboring columns. Note the origin of X and Y axes indicating the soma location of SBCs, filled and empty dots representing connected and unconnected neurons, respectively, and reduced cell density at the border of columns. (d) Values for the connectivity of SBC→L2/3I (SBC→L2/3ISame column: 13.0%, n=197 of 1,510 tested connections; SBC→L2/3INeighboring column: 0.0%, n=0 of 353 tested connections;χ2=51.5) and L2/3I→L5P (L2/3I→L5PSame column: 10.8%, n=577 of 5,330 tested connections; L2/3I→L5PNeighboring column: 0.0%, n=0 of 382 tested connections; χ2=46.0). Asterisks indicate p<0.05 (Chi-squared tests).
Fig. 4
Fig. 4. ENGCs form inhibitory circuits across multiple columns
(a) Reconstruction of L1 ENGC (green), L2 NGC (brown) and multiple L5 pyramidal neurons recorded simultaneously. The double colored dots indicate the putative synaptic contacts. Note the putative synaptic contacts from ENGC on terminal tuft dendrites of L5 pyramidal neurons. (b) Single action potentials elicited in presynaptic ENGC and NGC evoked uIPSPs in postsynaptic NGC, ENGC and two L5 pyramidal neurons (grey and black). The above schematic drawing shows symbolically the synaptic connections. Scale bars apply to all recording traces with 80 mV and 2 mV bars applied to traces with and without action potentials, respectively. (c) The plot shows the relative position of L2/3 interneurons and L5 pyramidal neurons to ENGCs and connectivity between ENGCs and L2/3 interneurons or L5 pyramidal neurons in the same and neighboring columns. Note the origin of X and Y axes indicating the soma location of ENGCs, filled and empty dots representing connected and unconnected neurons, respectively, and reduced cell density at the border of columns. (d) Values for the connectivity of ENGC→L2/3I (ENGC→L2/3ISame column: 22.1%, n=126 of 570 tested connections; ENGC→L2/3INeighboring column: 9.1 %, n=11 of 121 tested connections; χ2=10.6) and ENGC→L5P (ENGC→L5PSame column: 20.4%, n=53 of 259 tested connections; ENGC→L5PNeighboring column: 5.2%, n=6 of 116 tested connections; χ2=14.1). Asterisks indicate p<0.05 (Chi-squared tests).
Fig. 5
Fig. 5. L2/3 interneurons exhibit distinctive axonal arborization patterns
(a) Reconstruction of two MaCs (red), two NGCs (brown), two BTCs (yellow), two BPCs (dark green), two BaCs (cyan), two DBCs (blue) and two ChCs (purple) recorded in L2/3 of acute cortical slices. (b) Axonal length density plots show significant differences in axonal density at both the horizontal and vertical axes of L2/3 interneurons (MaC: n=15; NGC: n=28; BTCs: n=19; BPC: n=15; BaC: n=15; DBC: n=16; ChC: n=15; F>185; p<0.001; ANOVA tests). Note the origin of X and Y axes indicating the soma location of interneurons and positive direction of the vertical axis pointing to the cortical white matter.
Fig. 6
Fig. 6. L2/3 interneurons target different compartments of L5 pyramidal neurons
(a) Reconstruction of L1 SBC (pink), L2/3 NGC (brown), L2/3 BPC (dark green), L2/3 BaC (cyan) and two L5 pyramidal neurons (black and gray) recorded simultaneously from an acute cortical slice. The double colored dots indicate the putative synaptic contacts. (b) Single action potentials elicited in presynaptic SBC, NGC, BPC and BaC evoked uIPSPs in postsynaptic NGC, BPC, BaC and L5 pyramidal neurons, respectively. The above schematic drawing shows symbolically the synaptic connections. Scale bars apply to all recording traces with 80 mV and 4 mV bars applied to traces with and without action potentials, respectively. (c) The coordinates, or the horizontal and vertical distance of the synapses made by seven groups of L2/3 interneurons from the soma of L5 pyramidal neurons (MaC: lateral=41.2±4.3μm, vertical=890.3±7.4 μm; n=54 from 10 MaCs; NGC: lateral=28.8±3.8μm, vertical=774.3±8.6μm; n=62 from 17 NGCs; BTC: lateral=6.5±1.1μm, vertical=597.3±9.9μm; n=153 from 27 BTCs; BPC: lateral=14.5±3.2μm, vertical=299.5±14.4μm; n=35 from 8 BPCs; BaC: lateral=11.8±1.2μm, vertical=−0.6±1.5μm; n=105 from 28 BaCs; DBC: lateral=53.0±2.2μm, vertical=−19.2±4.3μm; n=110 from 26 DBCs; ChC: lateral=0.0±0.0 μm, vertical=−30.6±1.6μm; n=15 from 4 ChCs). The coordinates not shown (MaC←ENGC: lateral=41.6±7.5μm, vertical=898.2±8.3μm; n=14 from 3 MaCs; NGC←ENGC: lateral=32.1±5.3μm, vertical=783.6±11.5μm; n=38 from 11 NGCs; BTC←ENGC: lateral=8.0±1.8μm, vertical=601.8±24.0μm; n=38 from 7 BTCs; ENGC: lateral=70.8±7.6 μm, vertical=937.2±5.1 μm; n=27 from 6 ENGCs).
Fig. 7
Fig. 7. SBC→ and ENGC↔L2/3I→L5 pyramidal neuronal circuits serve different functions
(a) Reconstruction of L1-3 interneurons and L5 pyramidal neurons recorded simultaneously from an acute cortical slice. The double colored dots indicate the putative synaptic contacts. The schematic drawing shows symbolically the synaptic connections and dendritic recording sites. (b–d) The effects of continuous (in L1 interneurons) or brief (in L2/3 interneurons) depolarizing current injections on the complex dendritic complex spikes evoked by simultaneous near-threshold current injections from the dendritic and somatic recording electrodes in the shape of an EPSP. Scale bars apply to all recording traces in bd with 80 mV and 2 mV bars applied to traces with and without action potentials, respectively. Note the reduced number of somatic action potentials after activation of L2/3 interneurons (NBefore: 2.3±0.1; NAfter: 1.0±0.0, n=19;Z=4.0; p<0.005; Wilcoxon test) and NGC firing-evoked spikelets in ENGC. (e) The incidences of dendritic complex spikes after current injections in L1-3 interneurons. Values for the incidences in SBC (Iinj in L5P: 56.9±6.6%; Iinj in L2/3I and L5P: 1.4±1.3%; Z=2.7; Iinj in SBC, L2/3I and L5P: 70.8±6.3%; Z=2.0; n=9), and ENGC (Iinj in L5P: 62.5±5.3%; Iinj in ENGC and L5P: 13.8±5.1%; Z=2.9; Iinj in L2/3I and L5P; Z=2.8: 2.5±1.7%; Iinj in ENGC, L2/3I and L5P: 0.0±0.0%; Z=2.8; n=10) interneuronal circuits. Note larger uIPSPs induced by the synchronized firing in ENGCs and their targeting L2/3 interneurons (recorded in L5 pyramidal neurons at resting membrane potentials) (ENGC↔L2/3I: 0.55±0.07 mV; ENGC: 0.25±0.04 mV; Z=2.8; L2/3I: 0.33±0.05 mV; Z=2.8; n=10, p<0.01; Wilcoxon tests). Asterisks indicate p<0.05 (Wilcoxon tests).
Fig. 8
Fig. 8. SBC→ and ENGC↔L2/3I→L5 pyramidal neuronal circuits differ in function in vivo
(a–b) Reconstruction of L1 SBC (pink) or L1 ENGC (green) and L5 pyramidal neurons (black or gray) recorded simultaneously in intact animals. Note that the recording traces are aligned by spontaneous somatic action potentials or whisker stimulation, and arrowheads indicate the time of initiation of spontaneous somatic action potentials in simultaneously recorded L1 interneurons and dots indicate the dendritic complex spikes in L5 pyramidal neurons. (c) The average traces show that the firing in a SBC promoted and that in an ENGC suppressed the initiation of dendritic complex spikes (appeared as spikelet-like events due to averaging) recorded in L5 pyramidal neurons. Scale bars in ac apply to all recording traces with 80 mV and 2 mV bars applied to traces with and without action potentials, respectively. (d) Connectivity of synapses formed by SBCs and ENGCs on L5 pyramidal neurons recorded simultaneously in intact brains (SBC→L5P: 0.0%, n=0 of 18 tested connections; ENGC→L5P: 85.7%, n=7 of 8 tested connections; χ2=21.6; p<0.005; Chi-squared tests). (e) Time course of SBC-induced promotion (n=3) and ENGC-induced suppression (n=7) of dendritic complex spiking in L5 pyramidal neurons. Note SBC- and ENGC-mediated effects (spontaneous and whisker-evoked effects in pink and green and current pulse-evoked effects in dark magenta and dark green) and arrow indicating the time of somatic action potential initiation in L1 interneurons. Note that ENGC-mediated GABAB responses, although small, were effective in inducing a prolonged suppression of dendritic complex spiking, consistent with employment of a calcium conductance-suppression mechanism. Asterisks indicate p<0.05 (U=0.0; Mann-Whitney Rank Sum tests).

Comment in

Similar articles

Cited by

References

    1. McBain CJ, Fisahn A. Interneurons unbound. Nature reviews. Neuroscience. 2001;2:11–23. - PubMed
    1. Markram H, et al. Interneurons of the neocortical inhibitory system. Nature reviews. Neuroscience. 2004;5:793–807. - PubMed
    1. Bartos M, Vida I, Jonas P. Synaptic mechanisms of synchronized gamma oscillations in inhibitory interneuron networks. Nature reviews. Neuroscience. 2007;8:45–56. - PubMed
    1. Ascoli GA, et al. Petilla terminology: nomenclature of features of GABAergic interneurons of the cerebral cortex. Nature reviews. Neuroscience. 2008;9:557–568. - PMC - PubMed
    1. Burkhalter A. Many specialists for suppressing cortical excitation. Frontiers in neuroscience. 2008;2:155–167. doi: 10.3389/neuro.01.026.2008. - DOI - PMC - PubMed

Publication types