. 2013 Feb;16(2):201-9.
doi: 10.1038/nn.3307. Epub 2013 Jan 13.

Timothy syndrome is associated with activity-dependent dendritic retraction in rodent and human neurons

Affiliations

Timothy syndrome is associated with activity-dependent dendritic retraction in rodent and human neurons

Jocelyn F Krey et al. Nat Neurosci. 2013 Feb.

Abstract

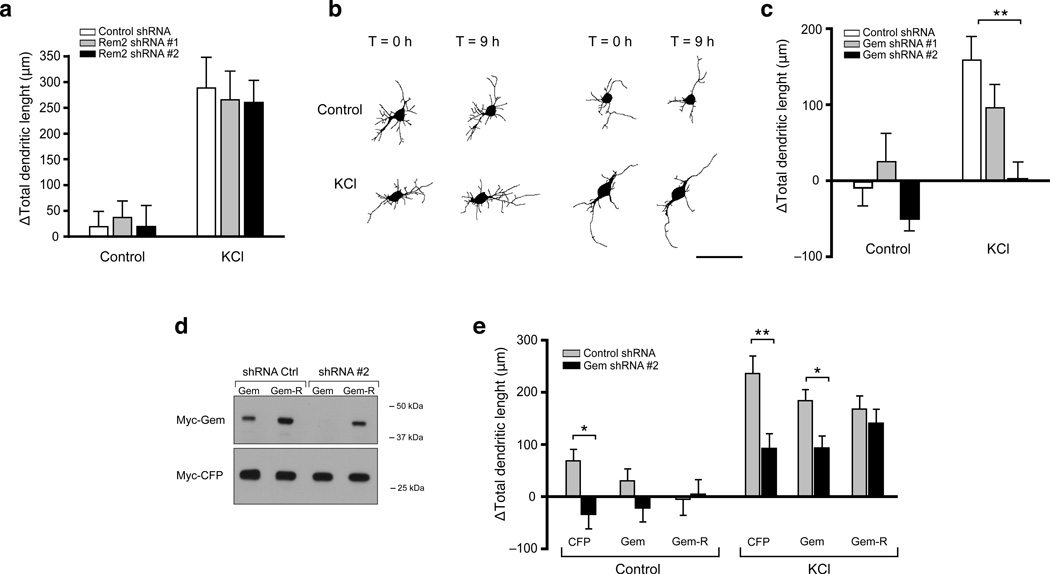
L-type voltage gated calcium channels have an important role in neuronal development by promoting dendritic growth and arborization. A point mutation in the gene encoding Ca(V)1.2 causes Timothy syndrome, a neurodevelopmental disorder associated with autism spectrum disorders (ASDs). We report that channels with the Timothy syndrome alteration cause activity-dependent dendrite retraction in rat and mouse neurons and in induced pluripotent stem cell (iPSC)-derived neurons from individuals with Timothy syndrome. Dendrite retraction was independent of calcium permeation through the mutant channel, was associated with ectopic activation of RhoA and was inhibited by overexpression of the channel-associated GTPase Gem. These results suggest that Ca(V)1.2 can activate RhoA signaling independently of Ca(2+) and provide insights into the cellular basis of Timothy syndrome and other ASDs.


Conflict of interest statement

The authors have no competing financial interests.

Figures

Figure 1
Figure 1. TS- CaV1.2 causes activity-dependent dendritic retraction
(a) Representative dendrite tracings of dissociated cortical neurons co-transfected with YFP and WT (left) or TS-CaV1.2 (right) and imaged before and after stimulation with 67 mM KCl. Scale bars are 50 µm. (b) Quantification of the change in total dendrite length following KCl stimulation in individual WT or TS-CaV1.2 transfected neurons (n ≥ 30 cells per condition; mean ± s.e.m.; ** p<0.001 by 2-way ANOVA, Bonferroni post-test). (c) Epifluorescence images of representative cortical neurons transfected as in (a) and imaged every 10 minutes following depolarization. Neurons transfected with TS-CaV1.2 show increased retraction of dendrites over the one-hour period (white arrowheads). Scale bar is 50 µm. (d) Quantification of the percentage of dendrites that showed an increase (percentage extended) or decrease (percentage retracted) in length of greater than 2 µm after 60 minutes in control or depolarizing (KCl) solutions (n=4 experiments, n≥ 25 dendrites/experiment, mean ± s.e.m., * p<0.05 by Student’s t-test). (e) Representative current clamp recording of a hippocampal neuron expressing channelrhodopsin-2 during illumination with 488 nM light. (f) Schematic representing the protocol used for illumination and image acquisition, and epifluorescence images of a representative hippocampal neuron transfected with TS channel. Scale bars are 50 µm. (g) Quantification of the percent change in total dendritic outgrowth in WT (n = 52) or TS-CaV1.2 (n = 36) expressing neurons over the time course of stimulation (mean ± s.e.m., ** p<0.001 by Student’s t-test).
Figure 2
Figure 2. Reduction in dendritic complexity in the basal dendrites of layer 2/3 pyramidal cortical neurons from TS+/− mice
(a) and (c) Representative images of Golgi-stained layer 2/3 pyramidal neurons from the frontal cortex of WT (a) or TS+/− (c) littermate P14 mice. (b) and (d) Representative dendrite tracings of the basal dendritic arbors of layer 2/3 pyramidal cortical neurons from WT (b) or TS+/− (d) P14 mice. Scale bars are 100 µm. (e, f, g) Average total length of all basal dendrites (e), basal branch number (f) and primary dendrite number (g) of pyramidal neurons from WT or TS+/− mice at P7 (n ≥ 27 neurons from 3 mice of each genotype) or P14 (n ≥ 42 neurons from 5 mice of each genotype). Mean ± s.e.m.; ** p<0.001 by unpaired Student’s t-test. (h) Histogram of the percentage of neurons from WT (n = 45) or TS+/− (n = 42) mice with different total dendritic lengths. Bin width = 400 µm, numbers on x-axis represent bin center.
Figure 3
Figure 3. Human iPSCs-derived TS neurons show activity dependent dendritic retraction
(a) Panel illustrating the stages of neural differentiation from iPSCs. Representative phase contrast images of iPSC colonies (scale bar 400 µm), embryoid bodies (scale bar 200 µm), neural rosettes (scale bar 200 µm), neurospheres (scale bar 200 µm), and immunocytochemistry of neurons (scale bar 50 µm; MAP2 in red, Hoechst blue). (b) Representative time course images of control (upper) and TS (lower) iPSC-derived neurons expressing YFP under the Synapsin-1 promoter. Scale bars are 50 µm. (c) Representative dendrite tracings for one control (blue) and one TS (red) neuron before and after stimulation with 67 mM KCl. (d) Average percentage change in total dendritic length over time in control (blue, n= 7 neurons from 2 control lines) and TS (red, n= 6 neurons from one patient line). (e) Average percentage change in total dendritic length in control (blue) and TS (red) derived neurons after 120 minutes of incubation in a 67 mM KCl depolarizing solution (n= 27 neurons from 3 control lines derived from 2 subjects, n= 36 neurons from 3 patient lines derived from 2 individuals with TS; **p < 0.005 by Student’s t-test; mean ± s.e.m.). (f) Quantification of the percentage of dendritic retraction (i.e., negative percent change in dendritic length at one particular time point as compared to the previous time point) or extension events (i.e., positive percent change in dendritic length at one particular time point as compared to the previous time point) in control (blue) and TS (red) iPSC-derived neurons in 5 mM KCl solution and in 67 mM KCl depolarizing solution (mean ± s.e.m., * p<0.05 by Student’s t-test).
Figure 4
Figure 4. TS-CaV1.2–mediated dendritic retraction is independent of Ca2+ flux through the channel
(a) Representative current traces measured in barium-containing external solution in response to a depolarizing pulse protocol (depicted above) from HEK-293 cells transfected with WT- (top) or TS- CaV1.2 (bottom) channels. (b) Average [Ca2+]i responses in untransfected dissociated cortical neurons (black) or neurons transfected with WT (blue) or TS (red) channels following depolarization with 67 mM KCl. (n ≥ 45 cells per condition; mean ± s.e.m.). Right hand panels are representative Ca2+ traces from individual neurons expressing either WT (blue) or TS-CaV1.2 (red) channels. (c) Average [Ca2+]i responses in neurons loaded with fura-2 and depolarized in the presence of 5 µM BayK 8644 (green) or 10 mM [Ca2+]e (blue) as compared to TS-CaV1.2 transfected cells (red) or untransfected neurons (black) (n ≥ 40 cells; mean ± s.e.m.). (d) Quantification of the change in total dendrite length following KCl stimulation in individual cortical neurons depolarized in the presence of 5 µM BayK 8644 (green) or 10 mM [Ca2+]e as in (a) (n ≥ 20 cells per condition; mean ± s.e.m.). (e) Average [Ca2+]i responses in cortical neurons transfected with TS-CaV1.2 and depolarized in various [Ca2+]e as indicated on the graph (n ≥ 30 cells per condition; mean ± s.e.m.). (f) Quantification of the change in total dendrite length in individual neurons transfected with WT or TS-CaV1.2 and depolarized in various [Ca2+]e as indicated (n ≥ 20 cells per condition; mean ± s.e.m.). (g) Currents measured in response to a depolarizing pulse protocol (depicted above) through WT 3EQ (top) or TS-CaV1.2 3EQ (bottom) channels transiently expressed in HEK-293 cells. No inward currents were detected for either channel. (h) Average [Ca2+]i responses of dissociated cortical neurons transfected with WT-CaV1.2 (blue), TS-CaV1.2 (red) or with the pore mutant TS-CaV1.2 3EQ (blue) (n ≥ 20 cells per condition; mean ± s.e.m.). (i) Representative dendrite tracings of cortical neurons transfected with WT 3EQ or TS-CaV1.2 3EQ pore mutant channels and imaged before and after depolarization. Scale bars are 50 µm. (j) Quantification of the average change in total dendrite length in individual neurons transfected with WT or TS-CaV1.2 channels or their 3EQ pore mutant versions (TS = −36.3 ± 16.7 µm; TS 3EQ = −39.3 ± 18.5 µm, n ≥ 50 cells per condition; mean ± s.e.m.).
Figure 5
Figure 5. Reducing Gem expression in cortical neurons prevents activity-induced dendritic arborization
(a) Quantification of the average change in total dendrite length in dissociated cortical neurons transfected with control shRNA, Rem2 shRNA #1 or Rem2 shRNA #2 after incubation in control or depolarizing conditions (n ≥ 16 cells per condition; mean ± s.e.m.). (b) Representative dendrite tracings of cortical neurons transfected with control shRNA or Gem shRNA #2 and imaged before and after depolarization with 67 mM KCl. Scale bars are 50 µm. (c) Quantification of the average change in total dendrite length in neurons transfected with control shRNA, Gem shRNA #1 or Gem shRNA #2 in control or depolarizing conditions (n ≥ 20 cells per condition; mean ± s.e.m.; * p<0.001 by 2-way ANOVA, Bonferroni post-test). (d) Cropped anti-Myc Western blot of lysates from HEK 293T cells co-transfected with Myc-Gem or Myc-Gem-R (which contains silent mutations that render it resistant to Gem shRNA #2) and either control shRNA or Gem shRNA #2. Cells were also transfected with Myc-CFP as a transfection and loading control. Full-length blots are presented in Supplementary Figure 10. (e) Quantification of the average change in total dendrite length in neurons co-transfected with control shRNA or Gem shRNA #2 and either CFP, Gem, or the shRNA-resistant Gem-R. The amount of activity-dependent dendritic arborization in neurons transfected with Gem-R and Gem shRNA #2 is not significantly different from that in cells expressing control shRNA (Gem-R + control shRNA = 168.9 ± 23.9; Gem-R + shRNA #2 = 141.6 ± 23.8). (n ≥ 20 cells per condition; mean ± s.e.m.; * p<0.05, ** p<0.001 by 2-way ANOVA, Bonferroni post-test).
Figure 6
Figure 6. Over-expression of Gem prevents dendritic retraction in TS-CaV1.2 expressing neurons and its effects are dependent on association with the CaVβ subunit
(a) Quantification of the average change in total dendrite length in neurons transfected with WT or TS-CaV1.2 along with either CFP or Gem (b) Quantification of the average change in total dendrite length in neurons expressing CFP or Gem as well as the pore mutant (4EQ) versions of WT or TS-CaV1.2 channels (n ≥ 17 cells per condition; mean ± s.e.m.). Neurons expressing TS-CaV1.2 4EQ (TS 4EQ) and Gem show a similar amount of activity-dependent dendritic arborization to neurons expressing WT-CaV1.2 4EQ channels (TS 4EQ + Gem = 232.2 ± 38.8; WT 4EQ + CFP = 240.9 ± 36.9; WT 4EQ + Gem = 233.1 ± 38.8). (c) Immunoprecipitation of HA-CaVβ3 with Myc-Gem in HEK 293T cell lysates. Gem constructs containing point mutations (R196A and V223A), known to prevent association with CaVβ325, fail to immunoprecipitate CaVβ3. Full-length blots are presented in Supplementary Figure 10. (d) Overexpression of GEM mutants R196A and V223A that do not bind to CaV1.2 fails to rescue dendritic retraction in TS neurons. (e) Immunoprecipitation of YFP-CaV1.2 and HA-CaVβ3 with Flag-Myc-Gem in lysates of Neuro2a cells that were transfected with either a WT or TS-CaV1.2 α-subunit as well as HA-CaVβ3 and/or Flag-Myc-Gem. Full-length blots are presented in Supplementary Figure 10. (f) Quantification of the relative intensity of co-immunoprecipitated TS-CaV1.2 channel bands compared to WT channel bands (bars represent average from 3 separate experiments, mean ± s.e.m.).
Figure 7
Figure 7. TS-CaV1.2 causes dendrite retraction by activating RhoA
(a) Representative images of YFP (left) and anti-pMLC2 (right) fluorescence in dissociated cortical neurons expressing WT or TS-CaV1.2 channels after depolarization with 67 mM KCl (white arrows point to transfected cells). Scale bar is 20 µm. (b) Quantification of the percent of WT or TS-CaV1.2 expressing neurons positive for pMLC staining in control or stimulated conditions (bars represent average from 3 separate experiments, n ≥ 40 cells per condition per experiment, mean ± s.e.m., * p<0.01 by 2-way ANOVA, Bonferroni post-test). (c) Quantification of the percent of WT or TS-3EQ expressing neurons positive for pMLC staining in control or stimulated conditions (bars represent average from 2 separate experiments, n ≥ 40 cells per condition per experiment, mean ± s.e.m., * p<0.05 by 2-way ANOVA, Bonferroni posttest). (d) Quantification of the average change in total dendrite length in neurons transfected with CFP alone or a CFP-tagged constitutively active RhoA (RhoV14-CFP) following incubation in control or depolarizing (67 mM KCl) solutions (n ≥ 15 cells per condition; mean ± s.e.m.; **p<0.001 by 2-way ANOVA, Bonferroni post-test). (e) Quantification of the average change in total dendrite length in neurons transfected with WT or TS-CaV1.2 along with either CFP alone or a CFP-tagged dominant negative RhoA (RhoN19) (n ≥ 20 cells per condition; mean ± s.e.m.; **p<0.001 by 2-way ANOVA, Bonferroni post-test). (f) Quantification of the average change in total dendrite length in neurons transfected with WT or TS-CaV1.2 and depolarized in the presence of 0.5 µg/ml C3 transferase or vehicle alone (n ≥ 15 cells per condition; mean ± s.e.m.; * p<0.01 by 2-way ANOVA, Bonferroni post-test). (g) Representative images of YFP (left) and anti-pMLC2 (right) fluorescence in cortical neurons expressing either CFP or Gem and TS-CaV1.2 channels after depolarization with 67 mM KCl (white arrows point to transfected cells). Scale bar is 20 µm. (h) Quantification of the percent of TS-CaV1.2 expressing neurons positive for pMLC2 staining in control or stimulated conditions (bars represent average from 2 separate experiments, n ≥ 50 cells per condition per experiment, mean ± s.e.m., * p<0.05, ** p<0.001 by 2-way ANOVA, Bonferroni post-test).

References

    1. McAllister AK, Katz LC, Lo DC. Neurotrophin regulation of cortical dendritic growth requires activity. Neuron. 1996;17:1057–1064. - PubMed
    1. Redmond L, Kashani AH, Ghosh A. Calcium regulation of dendritic growth via CaM kinase IV and CREB-mediated transcription. Neuron. 2002;34:999–1010. - PubMed
    1. Wong RO, Ghosh A. Activity-dependent regulation of dendritic growth and patterning. Nat Rev Neurosci. 2002;3:803–812. - PubMed
    1. Splawski I, et al. Ca(V)1.2 calcium channel dysfunction causes a multisystem disorder including arrhythmia and autism. Cell. 2004;119:19–31. - PubMed
    1. Dolmetsch R. Excitation-transcription coupling: signaling by ion channels to the nucleus. Sci STKE. 2003;2003:PE4. - PubMed

Publication types

MeSH terms

Supplementary concepts