. 2013 May;54(1):28-34.
doi: 10.1016/j.bone.2013.01.002. Epub 2013 Jan 11.

Early detection of burn induced heterotopic ossification using transcutaneous Raman spectroscopy

Affiliations

Early detection of burn induced heterotopic ossification using transcutaneous Raman spectroscopy

Jonathan R Peterson et al. Bone. 2013 May.

Abstract

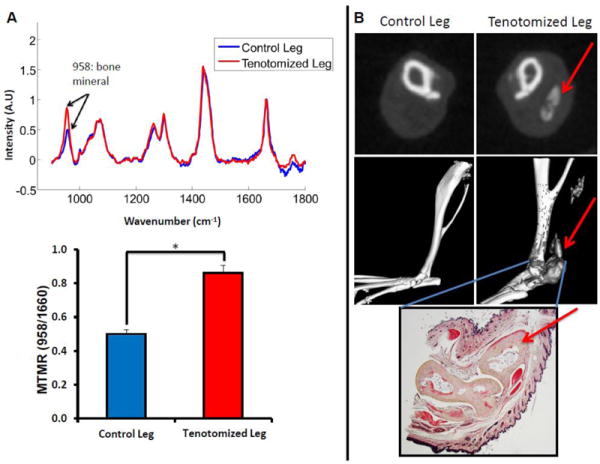
Introduction: Heterotopic ossification (HO), or the abnormal formation of bone in soft tissue, occurs in over 60% of major burn injuries and blast traumas. A significant need exists to improve the current diagnostic modalities for HO which are inadequate to diagnose and intervene on HO at early time-points. Raman spectroscopy has been used in previous studies to report on changes in bone composition during bone development but has not yet been applied to burn induced HO. In this study, we validate transcutaneous, in-vivo Raman spectroscopy as a methodology for early diagnosis of HO in mice following a burn injury.

Methods: An Achilles tenotomy model was used to study HO formation. Following tenotomy, mice were divided into burn and sham groups with exposure of 30% surface area on the dorsum to 60° water or 30° water for 18s respectively. In-vivo, transcutaneous Raman spectroscopy was performed at early time points (5 days, 2 and 3 weeks) and a late time point (3 months) on both the tenotomized and non-injured leg. These same samples were then dissected down to the bone and ex-vivo Raman measurements were performed on the excised tissue. Bone formation was verified with Micro CT and histology at corresponding time-points.

Results: Our Raman probe allowed non-invasive, transcutaneous evaluation of heterotopic bone formation. Raman data showed significantly increased bone mineral signaling in the tenotomy compared to control leg at 5 days post injury, with the difference increasing over time whereas Micro CT did not demonstrate heterotopic bone until three weeks. Ex-vivo Raman measurements showed significant differences in the amount of HO in the burn compared to sham groups and also showed differences in the spectra of new, ectopic bone compared to pre-existing cortical bone.

Conclusions: Burn injury increases the likelihood of developing HO when combined with traumatic injury. In our in-vivo mouse model, Raman spectroscopy allowed for detection of HO formation as early as 5 days post injury. Changes in bone mineral and matrix composition of the new bone were also evidenced in the Raman spectra which could facilitate early identification of HO and allow more timely therapy decisions for HO patients.


Conflict of interest statement

Conflicts of Interest: None

Figures

Figure 1
Figure 1
Raman spectroscopy detects bone tissue transcutaneously. A. Apparatus for non-invasive Raman measurement on mice. Excitation fiber (red) and multiple collection fibers (green) allow for transcutaneous in-vivo imaging of mouse. B. Representative Raman spectrum of mouse with known development of HO 3 months after tenotomy and burn injury. Red arrows point to peaks of interest in the Spectra: Phosphate and Carbonate bone mineral components at 958cm-1 and 1070cm-1 respectively, matrix lipids (CH2 deformation) at 1450cm-1, and matrix proteins and collagen (Amide I) at 1660 cm-1. The 1450 cm-1 band is a combination of protein and lipids CH2 wagging vibrations.
Figure 2
Figure 2
Raman Spectroscopy and cross sectional Micro CT of Achilles tenotomy model on non-injured and on tenotomized leg at 3 months after injury and burn. A. (Top) Raman spectra of tenotomized leg (Red) and non-tentotmized control leg (blue) of a burn mouse that had known HO growth. Spectra are normalized to the protein matrix and collagen band at 1600cm-1 and superimposed to show differences in bone mineral signal at 958cm-1 (Bottom) Mineral to matrix ratio from Raman spectra demonstrates increased mineral content in the tenotomized leg (*, p<0.05) B. Micro CT confirmation of HO growth in the tenotomized leg seen in representative CT slices (Top) and 3D reconstructions (Middle). Red arrows indicate HO formation. Gray areas in the reconstructed image indicate ectopic bone. Histologic verification of ectopic bone growth with pentachrome stain (Bottom) showing bone as pale yellow. Red arrow indicates HO formation.
Figure 3
Figure 3
HO formation detected by Raman spectroscopy at 5 days post injury. A. (Left) Raman spectra from a mouse in the Burn group that would develop HO. Spectra are normalized to the FEP material reference band. (Right) Early data from 5 day, 2 week, and 3 week time points show changes via Raman spectroscopy and significant differences in MTMR (*, p<0.05). B. Earliest time point HO detected by CT is 3 weeks. (Left) Micro CT at 5 days and 3 weeks after tenotomy, gray area is newly forming bone with arrow showing nidus of developing HO. (Right) Picrosirius red stain confirming HO at 3 weeks after tenotomy in the same region as seen by Micro CT (arrow).
Figure 4
Figure 4
Raman spectroscopy measurements of bone mineral in Burn and Sham groups at 5 days, 2 weeks, and 3 months. A. Raman spectra around area of tenotomy. Arrows mark bone mineral, lipid, protein, and FEP reference material bands. Spectra are normalized to FEP reference material signal. Blue line demonstrates mice that received achilles tenotomy only. Red line demonstrates mice receiving burn injury plus achilles tenotomy. B. Bone mineral band intensity compared to matrix protein and collagen band intensity (MTMR) shown at 5 days, 2 weeks, and 3 months. Bone mineral ratio normalized to FEP reference band (*, p<.05). C. Micro CT measurements of HO formation in Sham and Burn mice at earliest detectable timepoint (3 weeks) and late time-point (3 months). Red arrow signifies HO growth (gray area, *, p<.05)
Figure 5
Figure 5
Characterization of HO and cortical bone by high resolution Raman Spectroscopy. A. Mean ex-vivo high resolution Raman spectra of excised microtomed tissue sections from the region near the tenotomy site of a burn mouse, 3 months after injury. Soft tissue (black), Micro CT predicted HO locations (red solid), Micro CT predicted potential HO locations – near the tenotomy site where HO had been seen in other specimens (red dotted), and cortical bone (blue) labeled for both Raman spectra and corresponding circled regions in the optical image (Right). The phosphate (958 cm-1) vibrational region is shown in the left upper inset, dotted line indicating the band center of normal cortical bone. B. Crystallinity and mineral to matrix ratio of microtomed tissue section from burn and tenotomized mouse. Raman spectra are normalized to the 1001 cm-1 phenylalanine peak. (* p<.05)

References

    1. Vanden Bossche L, Vanderstraeten G. Heterotopic ossification: a review. J Rehabil Med. 2005;37:129–136. - PubMed
    1. Potter BK, et al. Heterotopic ossification following combat-related trauma. J Bone Joint Surg Am. 2010;92(Suppl 2):74–89. - PubMed
    1. Cassar-Pullicino VN, et al. Sonographic diagnosis of heterotopic bone formation in spinal injury patients. Paraplegia. 1993;31:40–50. - PubMed
    1. Freed JH, Hahn H, Menter R, Dillon T. The use of the three-phase bone scan in the early diagnosis of heterotopic ossification (HO) and in the evaluation of Didronel therapy. Paraplegia. 1982;20:208–216. - PubMed
    1. McCreadie BR, Goulet RW, Feldkamp LA, Goldstein SA. Hierarchical structure of bone and micro-computed tomography. Adv Exp Med Biol. 2001;496:67–83. - PubMed

MeSH terms