. 2013 Feb;10(2):162-70.
doi: 10.1038/nmeth.2333. Epub 2013 Jan 13.

An optimized fluorescent probe for visualizing glutamate neurotransmission

Affiliations

An optimized fluorescent probe for visualizing glutamate neurotransmission

Jonathan S Marvin et al. Nat Methods. 2013 Feb.

Abstract

We describe an intensity-based glutamate-sensing fluorescent reporter (iGluSnFR) with signal-to-noise ratio and kinetics appropriate for in vivo imaging. We engineered iGluSnFR in vitro to maximize its fluorescence change, and we validated its utility for visualizing glutamate release by neurons and astrocytes in increasingly intact neurological systems. In hippocampal culture, iGluSnFR detected single field stimulus-evoked glutamate release events. In pyramidal neurons in acute brain slices, glutamate uncaging at single spines showed that iGluSnFR responds robustly and specifically to glutamate in situ, and responses correlate with voltage changes. In mouse retina, iGluSnFR-expressing neurons showed intact light-evoked excitatory currents, and the sensor revealed tonic glutamate signaling in response to light stimuli. In worms, glutamate signals preceded and predicted postsynaptic calcium transients. In zebrafish, iGluSnFR revealed spatial organization of direction-selective synaptic activity in the optic tectum. Finally, in mouse forelimb motor cortex, iGluSnFR expression in layer V pyramidal neurons revealed task-dependent single-spine activity during running.


Figures

Fig. 1
Fig. 1
Sensor development and in vitro characterization. a) Schematic representation of GltI-cpGFP insertion. Residues from both domains (blue and orange) contribute to the binding site for glutamate. The polypeptide chain starts in the N-terminal domain (blue), passes into the C-terminal domain (orange) and back through two beta-strands (long pointed shapes), and into a series of helices (circles). After residue GltI253 (or other residues, identified in gray for “failed” sensors), it enters cpGFP at strand 7 (GFP residue 148), runs through cpGFP, and exits (last GFP residue 147) to rejoin the remainder of GltI. The open (top), ligand-free state of the construct is dim, presumably due to distortion of the cpGFP beta-barrel (tilted triangles). Binding of glutamate (star) induces a conformational change. The closed (bottom) state is bright, presumably due to restoration of the beta-barrel. b) In vitro titration of L1LV/L2NP with glutamate (red) and aspartate (orange). In situ titration of iGluSnFR on HEK293 cells (green, two ROIs shown) and cultured neurons (blue, three ROIs shown). c) 2-photon fluorescence imaging of HEK293 cells expressing iGluSnFR. The green images are normalized to the peak intensity of the saturated (100 μM glutamate) image. Glutamate strongly increased fluorescence at the cell membrane, but not in intracellular compartments, as shown in the heat map.
Fig. 2
Fig. 2
Characterization of iGluSnFR in neuron/astrocyte co-culture. iGluSnFR localizes to the membrane of neurons (a) and astrocytes (b) after expression from synapsin and GFAP promoters, respectively, as shown by the intensity profile in white insets. Scale bar, 10 μm. Field stimulations evoke fluorescent responses in processes and somata of both neurons (c) and astrocytes (d). Single field stimulus-evoked iGluSnFR responses are easily observable in both neurons (e; rise t½ =15 ± 11 msec, decay t½ =92 ± 11 msec, s.d., n = 3 for all measurements) and astrocytes (f; rise t½ =30 ± 7 msec, decay t½ =85 ± 28 msec). Relative response of SuperGluSnFR reproduced from . The amplitude of response increases with additional field stimulations, plateauing in cyan at ~10 APs (g); additional stimulations increase the duration of the fluorescent signal (e,f), but not the amplitude. iMaltSnFR is a pH-sensitive but glutamate-insensitive control. h) Response of neurons infected with AAV.hSynapsin.iGluSnFR to “puffs” of glutamate/AlexaFluor 568 solution.
Fig. 3
Fig. 3
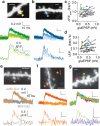
Two-photon glutamate uncaging-evoked iGluSnFR signals in acute hippocampal slices. Two-photon images of apical oblique (a) and basal (b) dendritic branch segments from CA1 hippocampal neurons filled via somatic patch pipettes with AlexaFluor 594. Yellow and blue symbols indicate locations of linescan through spine heads for iGluSnFR imaging at 920 nm (lines) and focal uncaging of MNI-glutamate at 720 nm (circles). Scale bar: 1 μm. Trial-averaged (n = 3 to 6) voltage traces recorded at somata (middle trace) and local spine head iGluSnFR signals (bottom trace) are shown for single pulse (0.2 msec dwell time) uncaging at three different laser powers. Summary of iGluSnFR signals (c, (ΔF/F)max; d, area) as a function of somatic EPSP amplitude evoked by single pulse two-photon uncaging for 28 apical oblique and basal dendritic spines, 3 laser powers each. Points connected by lines represent uncaging at increasing power at individual spines; colors match traces from (a) and (b). e) iGluSnFR and EPSP signals are substantially decreased when MNI-glutamate application is discontinued (n = 2). f) Limited iGluSnFR and EPSP signals are observed when uncaging (circles) and imaging (lines) are performed remotely from the relevant dendrite (light orange symbols, traces, n = 3). g) Glutamate uncaged at one spine (green) produces no measurable response in spines > 2 μm away (magenta, blue, n = 4 spines from 2 neurons).
Fig. 4
Fig. 4
Mouse retinal imaging in vitro. a) Two-photon fluorescence images of iGluSnFR-expressing dendrites (green) in the inner plexiform layer (IPL). Top image: z-projection of an iGluSnFR-expressing ganglion cell that was selected for whole-cell recording, and filled with a red fluorescent dye (AlexaFluor 568). Bottom images: single image planes that include the region of interest used for analysis of light-evoked fluorescence responses (dashed white line). b) Simultaneous patch-clamp and fluorescence recording (frame scan, 16 fps) from the cell shown in (a) (average of 8 repetitions, ± s.e.m. for fluorescence shown in grey). Excitatory currents have been inverted for comparison (negative current goes upward). Stimulus was a 150 μm diameter spot, modulated at 100% Michelson contrast (peak wavelength 398 nm). c) L-AP4 (20 μM) blocked glutamate release in the ON- but not in the OFF-layer of the IPL. d) Top, spontaneous fluorescence responses (asterisks) recorded with line scans (500 lps, ROI contained the cross section of a single, iGluSnFR-expressing dendrite) in the OFF-layer of the IPL during constant background illumination in the absence (top) and presence of TBOA (40 μM, bottom). e) Shape of the average spontaneous fluorescence event in the absence and presence of TBOA (n = 19 and 15 events, respectively). f) Fluorescence responses to drifting spatial sine wave stimuli recorded in the ON layer of the IPL (traces show single trials; 90% Michelson contrast). g) Modulation amplitude of the fluorescence response at the drift frequency peaked at a spatial frequency of 6 cycles mm-1 (average ± s.e.m. of 6 repetitions).
Fig. 5
Fig. 5
Glutamatergic input into C. elegans AVA neuron, and resulting somatic [Ca2+] signal. a) Cartoon representation of C. elegans and AVA neurons (left and right). Box indicates region imaged in (b). b) Fluorescence micrograph of iGluSnFR and RCaMP1e simultaneously expressed in AVA. Scale bar, 10 μm. c) iGluSnFR fluorescence changes in the process (green) precede somatic RCaMP fluorescence changes (red) during spontaneous AVA activity. The RCaMP response is well fit by a single leaky integrator model (cyan). Fluorescence signals are normalized to baseline and maximum fluorescence in each trace. d) In eat-4 mutant worms, occasional spontaneous RCaMP activity is seen in AVA, but is unaccompanied by iGluSnFR response.
Fig 6
Fig 6
In vivo imaging of awake behavior and motor task-associated glutamate transients in mouse primary motor cortex. a) Schematic illustrating experimental approach for injection of AAV.hSynapsin.iGluSnFR into layer V of primary motor cortex for in vivo transcranial two-photon microscopy. b) Two-photon image of low-density infection of primary motor cortex (forelimb region) with AAV.hSynapsin.iGluSnFR. Low-density infection results in sparse labeling of apical tuft dendrites of layer V neurons. Scale bar, 10 μm. c) Low-density viral labeling of iGluSnFR revealed apparent dendritic spines (red arrowhead) that show repetitive glutamate transients (four 2 sec. traces shown) during awake resting (top; 7 events over 8 seconds). In this example, forward running increased the frequency of glutamate events (bottom; 15 events detected during running over 8 seconds) and fluorescent changes (average ΔF/F during running was 27 ± 1.9 s.e.m. vs. 23 ± 3.2 while resting). Scale bar, 2 μm. d) Line scan of a dendritic segment in an awake animal running on the treadmill. Top panels: head-fixed animal undergoing left forelimb movement (red arrowhead) and a two-photon image of a dendritic segment from the apical tuft of motor cortex (scale bar, 5 μm). Boxed region contains the dendritic spine of interest (scale bar, 2 μm). e) Fluorescent trace of line-scan depicted in (d) reveals a rapid and robust glutamate response restricted to a dendritic spine (bottom panel of d); spine, S and black; associated dendrite, D and gray. f) iGluSnFR detection of task-specific glutamate responses during motor training. Example traces of fluorescence changes (2 sec. recordings) during 3 trials of reverse (yellow arrowheads) and forward (red arrowhead) running as well as awake resting state show reverse running triggers repetitive glutamate events with large changes in fluorescence (up to 0.55 (ΔF/F)max). No glutamate transients were detected under resting conditions and forward running in ROIs 1 and 2. A different ROI (#3) within the field-of-view activated under forward running conditions. g) iGluSnFR signals correlate with onset and offset of locomotion. *, glutamate events. h) Application of tetrodotoxin (TTX, 1 nM in ACSF) via a small craniotomy lateral to the thinned-skull imaging region (Supplementary Fig. 32) effectively blocked running-related glutamate transients (red arrowhead marks a glutamate transient during running) along apical tuft dendrites. Scale bar, 10 μm.

References

    1. Kullmann DM, Asztely F. Trends Neurosci. 1998;21:8–14. - PubMed
    1. Haydon PG. Nat Rev Neurosci. 2001;2:185–193. - PubMed
    1. Nedergaard M, Ransom B, Goldman SA. Trends Neurosci. 2003;26:523–530. - PubMed
    1. Choi DW. J Neurobiol. 1992;23:1261–1276. - PubMed
    1. Parsons CG, Danysz W, Quack G. Drug News Perspect. 1998;11:523–569. - PubMed

Publication types

MeSH terms