. 2013 Feb;10(2):171-7.
doi: 10.1038/nmeth.2332. Epub 2013 Jan 13.

Detection of histone modifications at specific gene loci in single cells in histological sections

Affiliations

Detection of histone modifications at specific gene loci in single cells in histological sections

Delphine Gomez et al. Nat Methods. 2013 Feb.

Abstract

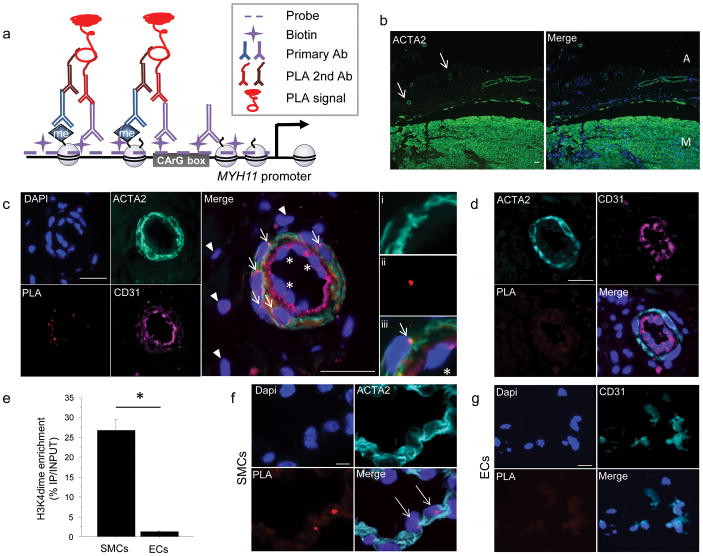
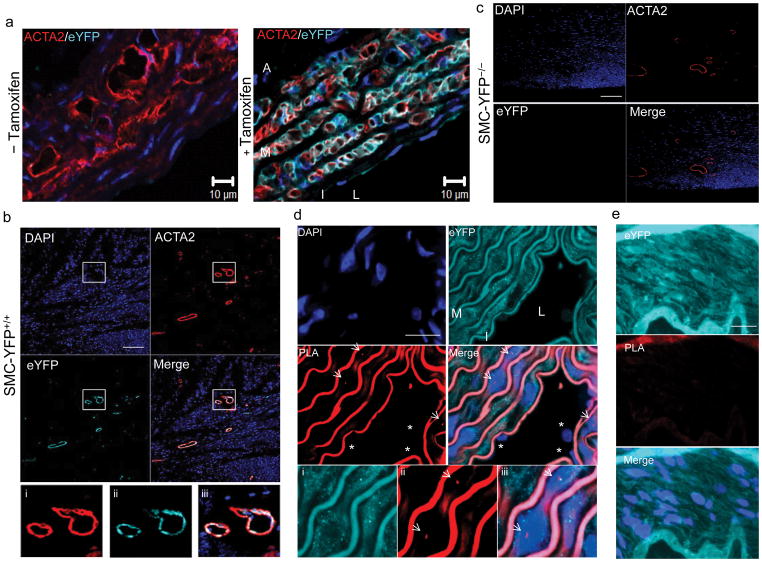
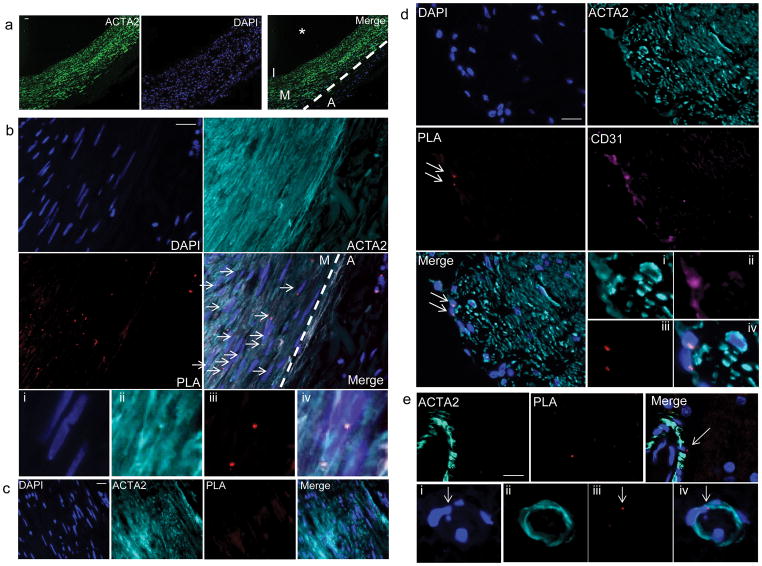
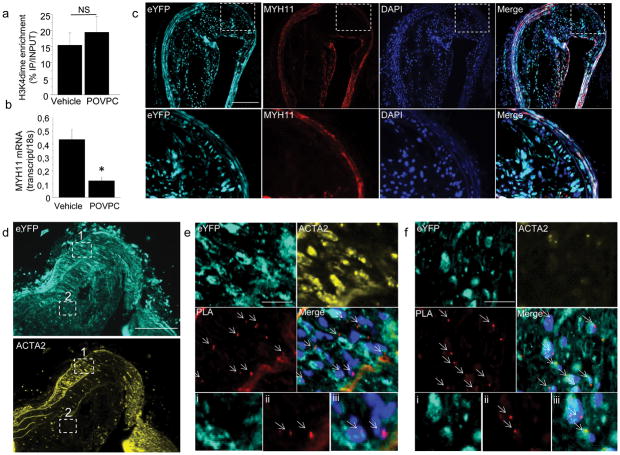
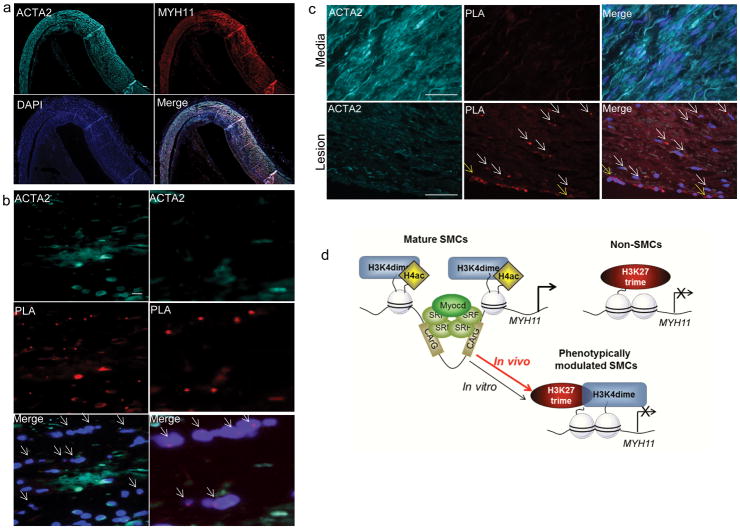
Chromatin immunoprecipitation assays have contributed greatly to our understanding of the role of histone modifications in gene regulation. However, they do not permit analysis with single-cell resolution, thus confounding analyses of heterogeneous cell populations. Here we present a method that permits visualization of histone modifications of single genomic loci with single-cell resolution in formaldehyde-fixed paraffin-embedded tissue sections based on combined use of in situ hybridization and proximity ligation assays. We show that dimethylation of lysine 4 of histone H3 (H3K4me2) at the MYH11 locus is restricted to the smooth muscle cell (SMC) lineage in human and mouse tissue sections and that the mark persists even in phenotypically modulated SMC in atherosclerotic lesions that show no detectable expression of SMC marker genes. This methodology has promise for broad applications in the study of epigenetic mechanisms in complex multicellular tissues in development and disease.


Figures

Figure 1
Figure 1. ISH-PLA: a new method of detection of histone modificationsat a single genomic locus in tissuesections
(a) Schematic of the combined in situ hybridization (ISH) and Proximity Ligation Assay (PLA) method for detecting H3K4dime of the MYH11 promoter. (b) Workflow of the ISH-PLA procedures. (c) Immunostaining of 5 μm-thick sections of human carotid artery for ACTA2 and DAPI (diamidinophenyindole). Two distinct layers are identified: the media (M) and the adventitia (A). Small vessels consisting of ACTA2+ SMCs are visualized within the adventitia (arrows). Scale bar = 100 μm. (d) ISH-PLA in adventitial small arteries (n = 5). PLA amplification (PLA+) is visualized as a red spot localized within nuclei. MYH11 H3K4dime PLA+ signal is restricted to ACTA2+ medial SMCs (arrows) and is absent from CD31+ ECs (stars) as well as adventitial fibroblasts (arrow heads). (i–iii): High magnification with i) ACTA2, ii) PLA and iii) merge.Scale bar = 50 μm. (e)ISH-PLA negative control using an empty vector probe in adventitial vessel of human carotid artery sections. A total absence of PLA amplification demonstrates that hybridization of the biotin-labeled MYH11 probe is required for ISH-PLA amplification. Scale bar = 50 μm (f) Conventional ChIP assays showing enrichment of H3K4dime of MYH11 in SMCs but not in ECs. Mean ± s.d.; n = 3; *P < 0.05. (g) ISH-PLA in SMCs (n = 3) and ECs (n = 3) in vitro. MYH11 H3K4dime PLA amplification is restricted to SMCs.Scale bars = 10 μm.
Figure 2
Figure 2. Validation of ISH-PLA using SMC lineage tracing mouse model
(a) SMC lineage tracing was done by crossing Myh11-CreERT2 transgenic mice with ROSA26 STOPfloxeYFP+/+ mice and treating mice with tamoxifen between six and eight weeks of age thereby providing SMC-specific and permanent lineage tagging of SMCswith eYFP(n =5).(b) Immunostaining of the aorta of SMC-eYFP+/+ mice for eYFP and ACTA2 with (bottom image) and without (top image) tamoxifen injections. eYFP expression was observed only after tamoxifen treatmentand was exclusively observed in SMCs within the media (M), compared with the intima (I) and the adventitia (A) negative for eYFP staining. L: lumen. Scale bar = 10 μm. (c) Assessment of eYFP expression in heart tissue sections of SMC-eYFP+/+ mice by immunostaining for eYFP (cyan), ACTA2 (red) and Dapi (blue). eYFP expression is strictly restricted to ACTA2+ cells. (d) SMC-eYFP−/−mice present a complete lack of eYFP expression in ACTA2+ cells in heart tissue sections. Scale bar (c–d) = 100 μm. e. Results of ISH-PLA in aortas from SMC-eYFP+/+ mice showing that Myh11 H3K4dime PLA positivity was restricted to eYFP+ medial SMCs(arrows)(media: M). No Myh11 H3K4dime PLA signal was detected in ECs (stars) (intima: I). L: lumen. i–iii show eYFP+ PLA+ SMCs at higher magnification with i) eYFP, ii) PLA and iii) merge. Scale bar = 10 μm. f. Negative control wherein ISH was done using an empty biotinylated vector in SMC-eYFP+/+ mice. No Myh11 H3K4dime PLA+ cells were identified.Scale bar = 10 μm.
Figure 3
Figure 3. Visualization of H3K4dime on the MYH11 promoter in SMCs in situ in histological sections of humancarotidarteries
(a) Immunostaining of human carotid artery sections illustrating the media (M) consisting primarily of ACTA2+SMCs, as well as the adventitia (A), intima (I)and the vessel lumen (*)(n= 5). Scale bar = 100 μm. (b) Results of MYH11 H3K4dime PLA in human carotid artery sections with DAPI (blue) and ACTA2 (cyan). PLA signal (red) was exclusively observed in ACTA2+ medial SMCs (arrows). None of the ACTA2− cells within the adventitia were MYH11 H3K4dime PLA+. Scale bar = 50 μm. Higher magnification from b with i) DAPI (blue), ii) ACTA2 (cyan), iii) PLA (red), and iv) merged image. (c) Negative control where ISH was done with an empty biotinylated vector followed by PLA with biotin and H3K4dime antibodies. Scale bar = 50 μm. (d) Detection of H3K27trime on the MYH11 promoter in human carotid artery sections. Results showed a positive MYH11 H3K27trime PLA signal in CD31+ ECs (arrows). In contrast, ACTA2+ cells were MYH11 H3K27trime PLA−. Scale bar = 50 μm. i–iv) Higher magnification images with: i) ACTA2 (cyan), ii) CD31 (purple), iii) PLA (red), and iv) merged, DAPI (blue). (e) MYH11 H3K4dime PLA analysis of human brain tissues stained with ACTA2 (cyan). SMCs in brain vessels are MYH11 H3K4dime PLA+ (arrow). Scale bar = 10 μm. i–iv) Small capillary within brain tissue with DAPI (i), ACTA2 (ii), PLA (iii) and merged image (iv).
Figure 4
Figure 4. H3K4dime on the MYH11 promoter persists during phenotypic switching in vivo in SMC lineage tracing mice developing atherosclerosis
(a) ChIP assay performed in cultured SMCs treated with vehicle (DMSO) or POVPC (10 μg/mL, 24h) showing similar H3K4dime enrichment on the MYH11. Mean s.d.; n = 3. (b) mRNA quantification of MYH11 showing POVPC-induced decrease in MYH11 mRNA level compared with vehicle. Mean ± s.d; n = 3; *P <0.01. (c)Identification of modulated SMCs in SMC-eYFP+/+ ApoE−/− mice fed with Western diet for 18 weeks. Brachiocephalic arteries (BCA) sections of these mice were stained with eYFP (cyan) and MYH11 (red). eYFP+ SMCs were identified within the media where they co-express MYH11 and within the atherosclerotic lesion where they lose expression of MYH11. Scale bar = 100 μm. (d) BCA sections of SMC-eYFP+/+ ApoE−/− mice were stained with eYFP (cyan) and ACTA2 (yellow) and were analyzed for MYH11 H3K4dime PLA.Scale bar = 100 μm.(e). Image corresponding to region 1 boxed in (d) Medial SMCs are ACTA2+ eYFP+ and Myh11 H3K4dime PLA+ (arrows). Higher magnification with eYFP (i), PLA (ii) and merged image with Dapi (iii). (f)Image corresponding to region 2 boxed in (d). Within the atherosclerotic lesion, a substantial fraction of eYFP+ACTA2− cells is Myh11 H3K4dime PLA+ indicating cells of SMC origin not identifiable based on detection of endogenous SMC markers (arrows). Scale bar (e–f) = 10 μm. Higher magnification with eYFP (i), PLA (ii) and merged image with Dapi (iii).
Figure 5
Figure 5. Identification of epigenetic regulation of phenotypically modulated SMCs within human coronary atherosclerotic lesions by ISH/PLA
(a) Immunostaining of 5 μm-thick sections of human coronary arteries illustrates loss of SM marker genes expression within the atherosclerotic lesion: ACTA2 (cyan), MYH11 (red) and Dapi (blue). Scale bar = 100μm. (b) Immunostaining was combined with MYH11 H3K4dime ISH/PLA with ACTA2 (cyan), PLA (red) and Dapi (blue). A large fraction of ACTA2− lesion cells are positive for MYH11 H3K4dime PLA (arrows), suggesting that these cells are of SMC origin. Higher magnification on the right panels. Scale bar = 10 μm. (c) MYH11 H3K27trime ISH-PLA in human coronary atherosclerotic lesions. Medial SMCs are strictly MYH11 H3K27trime PLA− whereas lesion SMCs (white arrows) and ECs (yellow arrows) are MYH11 H3K27trime PLA+. The lower panels are the higher magnification of the middle panels. Scale bar = 50 μm. (d) Cartoon summarizing the epigenetic regulation on the MYH11 promoter in mature SMCs, phenotypically modulated SMCs and non-SMCs in vivo.

Comment in

Similar articles

Cited by

References

    1. Jenuwein T, Allis CD. Translating the histone code. Science. 2001;293:1074–1080. - PubMed
    1. Kouzarides T. Chromatin modifications and their function. Cell. 2007;128:693–705. - PubMed
    1. Law JA, Jacobsen SE. Establishing, maintaining and modifying DNA methylation patterns in plants and animals. Nat Rev Genet. 2010;11:204–220. - PMC - PubMed
    1. Azuara V, et al. Chromatin signatures of pluripotent cell lines. Nat Cell Biol. 2006;8:532–538. - PubMed
    1. Bernstein BE, et al. A bivalent chromatin structure marks key developmental genes in embryonic stem cells. Cell. 2006;125:315–326. - PubMed

Publication types

Associated data