. 2013 Jun;38(7):1176-88.
doi: 10.1038/npp.2013.12. Epub 2013 Jan 11.

Ethanol reduces neuronal excitability of lateral orbitofrontal cortex neurons via a glycine receptor dependent mechanism

Affiliations

Ethanol reduces neuronal excitability of lateral orbitofrontal cortex neurons via a glycine receptor dependent mechanism

Kimberly A Badanich et al. Neuropsychopharmacology. 2013 Jun.

Abstract

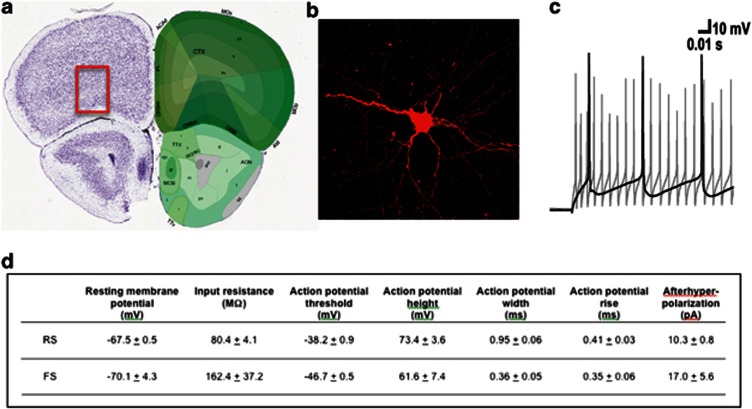
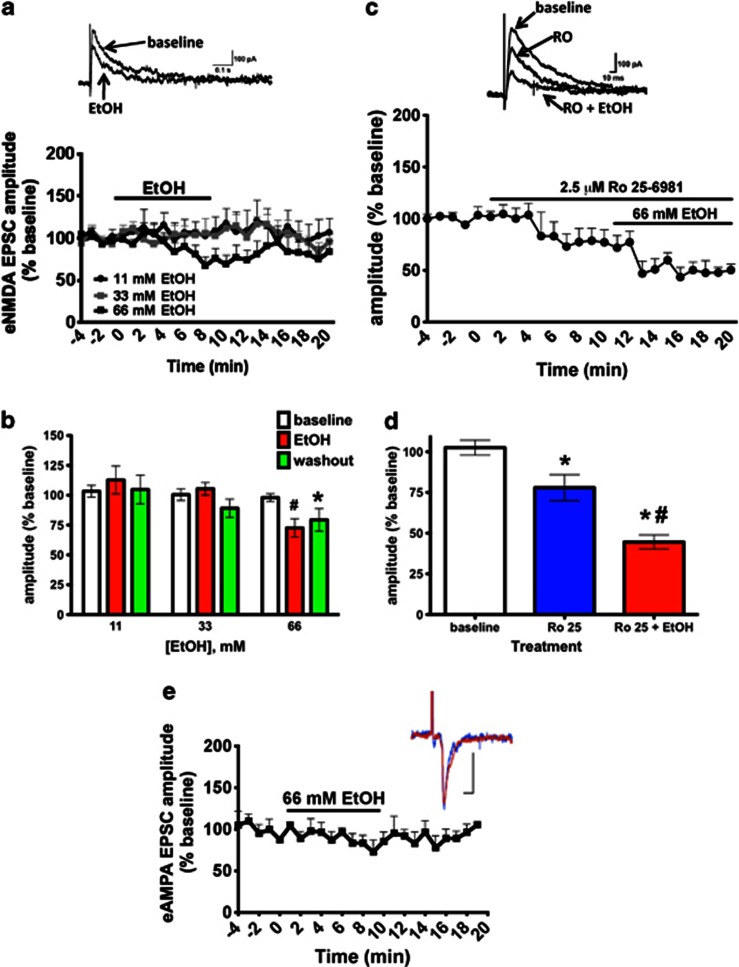
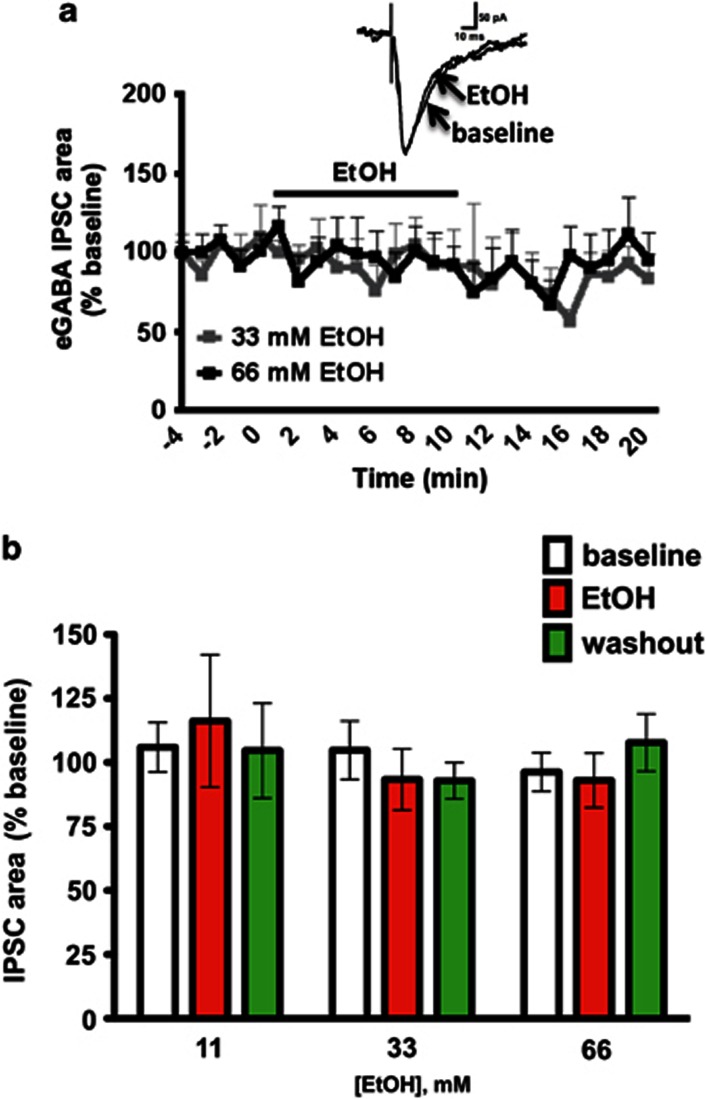
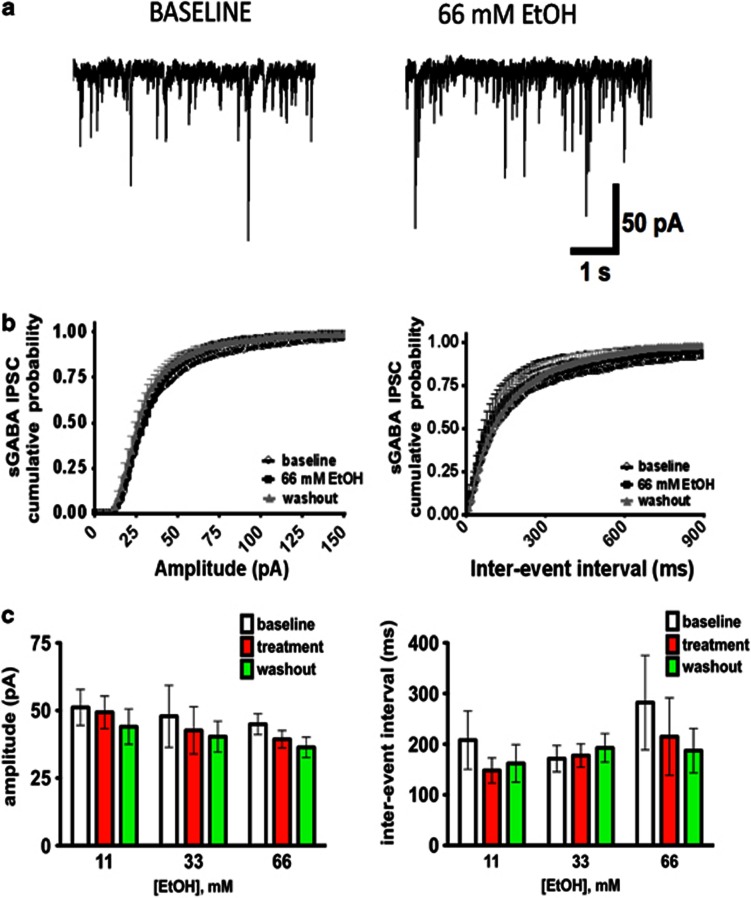
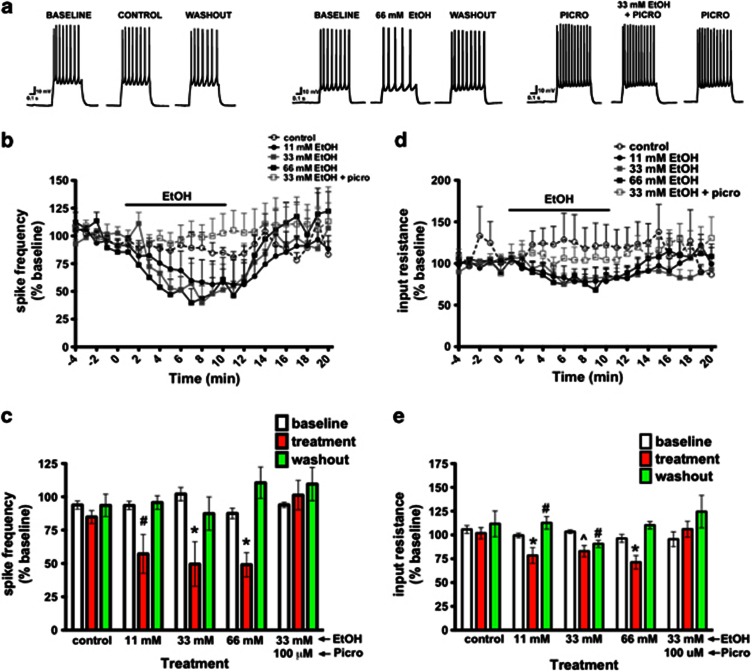
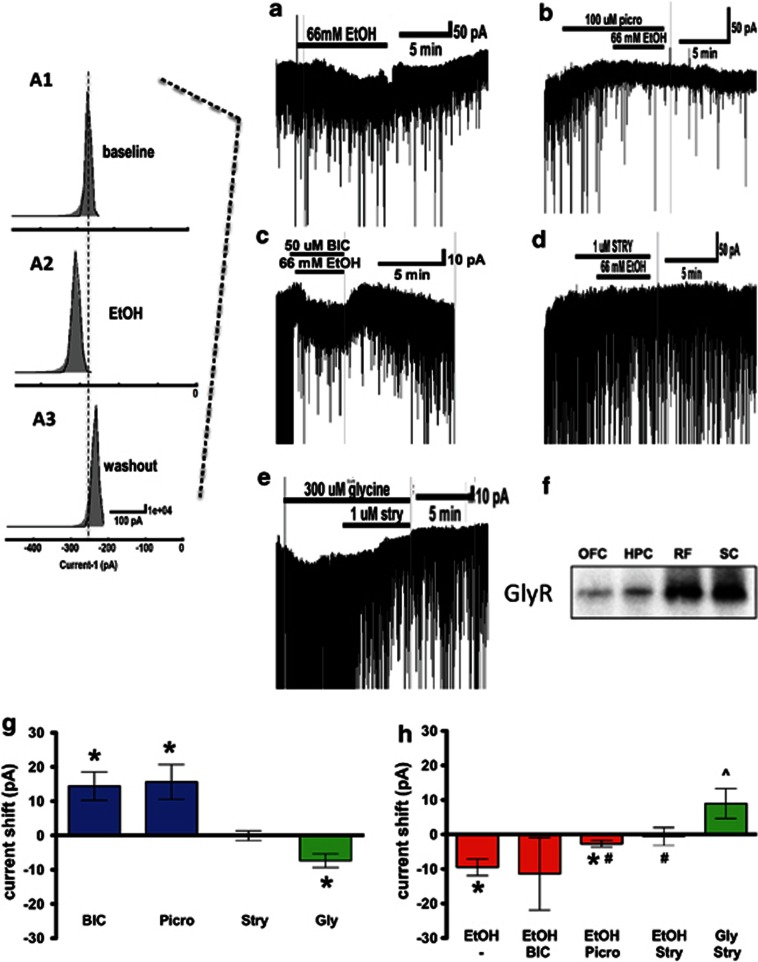
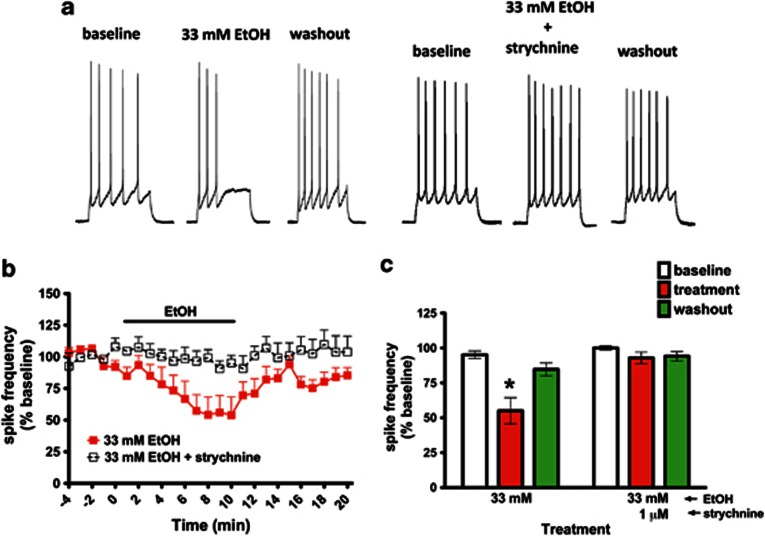
Trauma-induced damage to the orbitofrontal cortex (OFC) often results in behavioral inflexibility and impaired judgment. Human alcoholics exhibit similar cognitive deficits suggesting that OFC neurons are susceptible to alcohol-induced dysfunction. A previous study from this laboratory examined OFC mediated cognitive behaviors in mice and showed that behavioral flexibility during a reversal learning discrimination task was reduced in alcohol-dependent mice. Despite these intriguing findings, the actions of alcohol on OFC neuron function are unknown. To address this issue, slices containing the lateral OFC (lOFC) were prepared from adult C57BL/6J mice and whole-cell patch clamp electrophysiology was used to characterize the effects of ethanol (EtOH) on neuronal function. EtOH (66 mM) had no effect on AMPA-mediated EPSCs but decreased those mediated by NMDA receptors. EtOH (11-66 mM) also decreased current-evoked spike firing and this was accompanied by a decrease in input resistance and a modest hyperpolarization. EtOH inhibition of spike firing was prevented by the GABAA antagonist picrotoxin, but EtOH had no effect on evoked or spontaneous GABA IPSCs. EtOH increased the holding current of voltage-clamped neurons and this action was blocked by picrotoxin but not the more selective GABAA antagonist biccuculine. The glycine receptor antagonist strychnine also prevented EtOH's effect on holding current and spike firing, and western blotting revealed the presence of glycine receptors in lOFC. Overall, these results suggest that acutely, EtOH may reduce lOFC function via a glycine receptor dependent process and this may trigger neuroadaptive mechanisms that contribute to the impairment of OFC-dependent behaviors in alcohol-dependent subjects.


Figures

Figure 1
Figure 1
Neurophysiological characteristics of lOFC neurons. (a) Coronal slice from adult mouse brain atlas (Allen Mouse Brain Atlas (Internet). Seattle (WA): Allen Institute for Brain Science. 2009. Available from: http://mouse.brain-map.org). The boundaries of the targeted recording site (lateral OFC) are outlined in the red box. (b) Confocal image of biocytin filled regular spiking lOFC neuron. (c) Example traces of regular spiking (RS) and fast spiking (FS) neurons during current injection. Gray trace=fast spiking; Black trace=regular spiking. (d) Electrophysiological characteristics of OFC neurons recorded under control conditions. For each dependent measure, raw scores are presented as mean ±SEM. N=25 (RS), 4(FS).
Figure 2
Figure 2
Acute EtOH inhibits stimulus-evoked NMDA but not AMPA EPSCs in lOFC neurons. (a) Time-course effects of EtOH on amplitude of evoked NMDA and AMPA EPSCs. Data shown are percent of pre-EtOH baseline. Representative traces show NMDA currents recorded at +40 mV in the absence and presence of 66 mM EtOH. (b) Summary chart shows amplitude of NMDA EPSCs during the last 2 min of each recording epoch (baseline, treatment, washout) for 11, 33, and 66 mM EtOH. Only the highest EtOH concentration (66 mM) inhibited NMDA EPSC amplitude. Symbols: *=differs from baseline. #=differs from baseline, 11, 33 mM EtOH. (c) Time-course effects of the NR2B-NMDA receptor antagonist RO 25-6981 and EtOH on amplitudes of evoked NMDA EPSCs. Example trace shows effects of RO 25-6981 alone and in combination with EtOH on evoked NMDA EPSCs. (d) Summary chart shows amplitude (as percent of pre-drug control) for evoked NMDA EPSCs during the last 2 min of each recording epoch (baseline, RO 25-6981, RO 25-6981+EtOH). Symbols: *=differs from baseline. #=differs from RO 25-6981. (e) EtOH (66 mM) has no effect on amplitude of evoked AMPA EPSCs. Data shown are percent of pre-EtOH baseline. Representative traces show AMPA currents in the absence (blue) and presence (red) of 66 mM EtOH. All bars and data points represent mean ±SEM. N=4–7 for each treatment group. A color reproduction of this figure is available on the Neuropsychopharmacology journal online.
Figure 3
Figure 3
Acute EtOH does not alter evoked GABA IPSCs in lOFC neurons. (a) Time-course effects of EtOH on amplitude evoked GABA IPSCs (normalized to % of pre-EtOH baseline). Example trace shows no change in amplitude during exposure to 66 mM EtOH. (b) Summary chart showing amplitude of GABA IPSCs during the last 2 min of each epoch (baseline, treatment, washout) are shown for 11, 33, and 66 mM EtOH. There were no significant differences in amplitude for any of the Dose or Session groups. All bars and data points represent mean ±SEM. N=5–6 for each treatment group.
Figure 4
Figure 4
Acute EtOH does not alter spontaneous GABA IPSCs in lOFC neurons. (a) Representative traces showing spontaneous GABA IPSCs in the absence (left) and presence of 66 mM EtOH (right). (b) Cumulative probability curves for amplitude (left) and inter-event-interval (right) of spontaneous GABA IPSCs. Curves represent data collected during baseline, 66 mM EtOH and washout recording epochs. (c) Summary charts showing amplitude (left) and inter-event interval (right) for spontaneous GABA IPSCs during the last 2 min of each recording epoch (baseline, treatment, washout) are shown for 11, 33, and 66 mM EtOH. There were no significant differences in amplitude or inter-event interval for any of the Dose or Session groups. All bars and data points represent mean ±SEM. N=5–7 for each treatment group.
Figure 5
Figure 5
EtOH inhibits current-induced spiking in lOFC neurons. (a) Representative traces showing spiking under control conditions (left panel) and during application of EtOH (66 mM; middle panel) or EtOH (33 mM) and the GABA antagonist, picrotoxin (right panel). Time-course effects of EtOH on (b) spike frequency and (c) input resistance for the entire recording session for each of the treatment groups (control, 11, 33, 66 mM EtOH and 33 mM EtOH+100 mM picrotoxin). Data are presented as percent of pre-EtOH baseline. Summary charts showing spike frequency (d) or input resistance (e) during the last 2 min of each recording epoch (baseline, treatment, washout) for each of the treatment groups. Picrotoxin blocked acute EtOH-mediated decrease in spike frequency and input resistance. Symbols: *=differs from all other groups. #=differs from control, baseline, washout; ^=differs from picro baseline. All bars and data points represent mean ±SEM. N=5 for each treatment group.
Figure 6
Figure 6
EtOH increases tonic current in lOFC neurons. Representative traces showing changes in holding current for (a) EtOH, (b) picrotoxin+EtOH, (c) bicuculline+EtOH, (d) strychnine+EtOH and (e) glycine+strychnine. In order to match the recording conditions used during the spiking studies (Figure 5), no pharmacological blocking agents were added to the recording aCSF in these experiments. Gaussian fit of tonic current amplitudes measured before, during and after EtOH exposure are shown in panels A1–A3. Vertical dashed lines in a1–a3 indicate baseline holding current values. (f) Representative western blot showing expression of glycine receptors in lOFC, hippocampus (HPC), reticular formation (RF) and spinal cord (SC). (g–h) Summary graphs show mean change in holding current (pA) each treatment group. Bars represent mean ±SEM. N=5–8 for each treatment group. Symbols: *=differs from zero; #=differs from EtOH; ^=differs from glycine.
Figure 7
Figure 7
The glycine antagonist strychnine prevents EtOH-mediated inhibition of spiking in lOFC neurons. (a) Representative traces showing effects of EtOH (left panels) or EtOH plus the glycine antagonist strychnine (right panels) on current-induced spike firing. (b) Time-course of effects of 33 mM EtOH alone or 33 mM EtOH plus strychnine on spike frequency. Data are presented as percent of pre-drug baseline. (c) Summary chart showing effects of EtOH or EtOH plus strychnine on spike frequency during the last 2 min of each recording epoch (baseline, treatment, washout). Symbols: *=differs from all other groups. All bars and data points represent mean ±SEM. N=5–6 for each treatment group.

Similar articles

Cited by

References

    1. Adermark L, Clarke RB, Olsson T, Hansson E, Soderpalm B, Ericson M. Implications for glycine receptors and astrocytes in ethanol-induced elevation of dopamine levels in the nucleus accumbens. Addict Biol. 2011;16:43–54. - PubMed
    1. Adinoff B. Neurobiologic processes in drug reward and addiction. Harv Rev Psychiatry. 2004;12:305–320. - PMC - PubMed
    1. Alvestad RM, Grosshans DR, Coultrap SJ, Nakazawa T, Yamamoto T, Browning MD. Tyrosine dephosphorylation and ethanol inhibition of N-Methyl-D-aspartate receptor function. J Biol Chem. 2003;278:11020–11025. - PubMed
    1. Anders DL, Blevins T, Sutton G, Chandler LJ, Woodward JJ. Effects of c-Src tyrosine kinase on ethanol sensitivity of recombinant NMDA receptors expressed in HEK 293 cells. Alcohol Clin Exp Res. 1999;23:357–362. - PubMed
    1. Attwell D, Barbour B, Szatkowski M. Nonvesicular release of neurotransmitter. Neuron. 1993;11:401–407. - PubMed

Publication types

MeSH terms

LinkOut - more resources