. 2013 Mar;71(3):777-87.
doi: 10.1007/s00280-013-2071-7. Epub 2013 Jan 13.

p75NTR: an enhancer of fenretinide toxicity in neuroblastoma

Affiliations

p75NTR: an enhancer of fenretinide toxicity in neuroblastoma

Veena Ganeshan et al. Cancer Chemother Pharmacol. 2013 Mar.

Abstract

Objective: Neuroblastoma is a common, frequently fatal, neural crest tumor of childhood. Chemotherapy-resistant neuroblastoma cells typically have Schwann cell-like ("S-type") morphology and express the p75 neurotrophin receptor (p75NTR). p75NTR has been previously shown to modulate the redox state of neural crest tumor cells. We, therefore, hypothesized that p75NTR expression level would influence the effects of the redox-active chemotherapeutic drug fenretinide on neuroblastoma cells.

Methods: Transfection and lentiviral transduction were used to manipulate p75NTR expression in these cell lines. Sensitivity to fenretinide was determined by concentration- and time-cell survival studies. Apoptosis incidence was determined by morphological assessment and examination of cleavage of poly-ADP ribose polymerase and caspase-3. Generation and subcellular localization of reactive oxygen species were quantified using species- and site-specific stains and by examining the effects of site-selective antioxidants on cell survival after fenretinide treatment. Studies of mitochondrial electron transport employed specific inhibitors of individual proteins in the electron transport chain.

Results: Knockdown of p75NTR attenuates fenretinide-induced accumulation of mitochondrial superoxide and apoptosis. Overexpression of p75NTR has the opposite effects. Pretreatment of cells with 2-thenoyltrifluoroacetone or dehydroascorbic acid uniquely prevents mitochondrial superoxide accumulation and cell death after fenretinide treatment, indicating that mitochondrial complex II is the likely site of fenretinide-induced superoxide generation and p75NTR-induced potentiation of these phenomena.

Conclusion: Modification of expression of p75NTR in a particular neuroblastoma cell line modifies its susceptibility to fenretinide. Enhancers of p75NTR expression or signaling could be potential drugs for use as adjuncts to chemotherapy of neural tumors.


Conflict of interest statement

Conflict of interest

None of the authors have any real or perceivable conflicts of interest or financial relationships relevant to the contents of this manuscript.

Figures

Fig. 1
Fig. 1
Fenretinide induces cell death in SH-EP1 human neuroblastoma cells. a Concentration–response curve for fenretinide (0–20 µM; 72 h) treatment of SH-EP1 cells. Manual cell counts were performed and the mean ± SEM of counts from 3 high power fields are shown. Results from a representative experiment of three performed are shown. b Metabolic assay for cell viability (Alamar blue) demonstrating differential results at 24 (black squares) and 72 (gray circles) h exposure to fenretinide (0–10 µM). At all concentrations of fenretinide, values at 24 h differ from those for 72 h treatment with p < 0.01. c Differential lactate dehydrogenase (LDH) release from SH-EP1 neuroblastoma cells treated with fenretinide (0–10 µM) for 24 (black squares) and 72 h (gray circles). At all concentrations of fenretinide of or above 4 µM, values at 24 h differ from those for 72 h treatment with p < 0.01. d Alamar blue assay showing differential sensitivity to fenretinide of SH-EP1 cells transfected with an expression construct for p75NTR and, therefore, overexpressing the receptor (OE) or a control construct (MOCK). At all concentrations of fenretinide of or above 6 µM, values at 24 h differ from those for 72 h treatment with p < 0.05
Fig. 2
Fig. 2
Fenretinide-induced death of SH-EP1 human neuroblastoma cells is accompanied by concentration- and time-dependent cleavage of poly-ADP ribose polymerase (PARP) and caspase-3 and concentration-dependent nuclear fragmentation and condensation. a Concentration-dependent fenretinide-induced cleavage of PARP at 24 h of fenretinide exposure. A representative Western blot is shown. For this and all subsequent graphs, error bars signify the SEM of three or more independent values. *p < 0.05; **p < 0.01 relative to control; Student’s t-test. b Time course of PARP cleavage in fenretinidez-treated (10 µM) SH-EP1 cells. **p < 0.01; ***p < 0.001 relative to t = 0; Student’s t-test. c Time course of caspase-3 cleavage in fenretinide-treated (10 µM) SH-EP1 cells. *p < 0.05 relative to t = 1 h; Student’s t-test. d Hoechst dye 33242 staining of SH-EP1 cells following fenretinide treatment (10 µM; 72 h) demonstrates apoptotic nuclear morphology. e Concentration dependence of apoptotic nuclear morphology after fenretinide treatment (72 h) in SH-EP1 cells. **p < 0.01; relative to [fenretinide] = 0; Student’s t-test
Fig. 3
Fig. 3
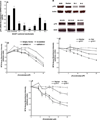
Knockdown and overexpression of p75NTR in SH-EP1 cells. a Western blot demonstrates that shRNA transfection (p75 shRNA) results in 50 % knockdown of p75NTR protein expression relative to scrambled control RNA (Scr), and transfection with a constitutive expression construct for p75NTR (p75OE) results in twofold overexpression relative to transfection with a control empty plasmid (Mock p75OE). The graph depicts mean ± SEM for three independent determinations of optical density of the p75NTR Western blot bands. **p < 0.01 relative to respective control; Student’s t-test. b, c Stable knockdown of p75NTR expression with shRNA shifts the fenretinide concentration–response curve of SH-EP1 human neuroblastoma cells. b Alamar blue assay showing differential sensitivity to fenretinide of SH-EP1 cells transfected with p75NTR shRNA (white squares) or scrambled control shRNA (gray circles), respectively. At all concentrations of fenretinide, values for p75shRNA-transfected cells differ from those for scrambled RNA-transfected cells with p < 0.01. c Caspase-3 cleavage is first seen by 24 h of fenretinide exposure in p75shRNA- (black bars) and scrambled shRNA- (white bars) treated cells, but is 50–80 % higher in scrambled transfectants than in p75shRNA knockdown cells. **p < 0.01 relative to SCR control; Student’s t-test
Fig. 4
Fig. 4
p75NTR knockdown by lentiviral transduction in human neuroblastoma cells and sensitivity to fenretinide treatment. a Lentiviral transduction of SH-EP1 (S-type) cells with a p75shRNA demonstrates 80–90 % knockdown in the 5-1 and 6-1 transfectants relative to empty vector and scrambled control transductants. *p < 0.05; **p < 0.01; ***p < 0.001 relative to scrambled RNA-transduced control cells; Student’s t-test. b p75NTR protein expression in lentiviral knockdown of SH-EP1 cells. Western blot composite showing lentiviral knockdown of p75NTR in SH-EP1 cells with corresponding actin loading controls. c p75NTR expression in other neuroblastoma cell lines. Western blot composite showing p75NTR expression in SH-EP1, SK-N-AS, and SH-SY5Y cells with corresponding actin loading controls. d Lentiviral knockdown of p75NTR makes SH-EP1 cells more resistant to fenretinide-induced death than vector and scrambled control transductants. Values for vector-transduced cells are not significantly different from those for scrambled construct-transduced cells. Values for 5-1 cells differ from those for scrambled construct-transduced cells with p < 0.05; those for 6-1 cells differ from those for scrambled construct-transduced cells with p < 0.01. e Lentiviral knockdown of p75NTR in SH-SY5Y (N-type) cells induces resistance to fenretinide treatment relative to empty vector- and scrambled construct-transduced controls. This effect is not apparent below 10 µM fenretinide, assumed because SH-SY5Y and other N-type cells express only very low levels of p75NTR in their native state (see c, above). Values for vector-transduced cells are not significantly different from those for scrambled construct-transduced cells. Values for 5-1 and 6-1 cells differ from those for scrambled construct-transduced cells with p < 0.01. f Lentiviral knockdown of p75NTR in SK-N-AS (S-type) cells also induces resistance to fenretinide treatment relative to empty vector- and scrambled construct-transduced controls. Values for vector-transduced cells are not significantly different from those for scrambled construct-transduced cells. Values for 5-1 cells differ from those for scrambled construct-transduced cells with p < 0.01; those for 6-1 cells differ from those for scrambled construct-transduced cells with p < 0.001
Fig. 5
Fig. 5
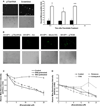
Induction by fenretinide of accumulation of mitochondrial reactive oxygen species in SH-EP1 human neuroblastoma cells. a MitoSOX™ staining of SH-EP1 cells following fenretinide treatment demonstrates accumulation of superoxide in mitochondria within 30 min that persists for at least 3 h of exposure. Superoxide accumulation is more robust in scrambled construct transfectants (white bars) than in p75shRNA transfectants (black bars). *p < 0.05; **p < 0.01 relative to p75shRNA transfectants; Student’s t-test. b DCFDA staining shows that there is no statistically significant increase in cytosolic H2O2 after fenretinide treatment of scrambled construct- or p75shRNA-transfected SH-EP1 cells. There is, however, a rise in cytosolic H2O2 in p75NTR-overexpressing (OE) SH-EP1 cells after fenretinide treatment. c Fenretinide-induced cell death is inhibited when SH-EP1 cells are pretreated with dehydroascorbic acid (DHA; p < 0.01 relative to medium-treated control) but not N-acetylcysteine (NAC; p > 0.05 relative to medium-treated control). d Pretreatment of SH-EP1 cells with mitochondrial complex inhibitors before treatment with fenretinide suggests that complex II is a major source of accumulation of mitochondrial reactive oxygen species. Pretreatment with rotenone (complex I inhibitor) and antimycin A (complex III inhibitor) have no effect, but pretreatment with TTFA inhibits (p = 0.05 relative to medium-treated control at concentrations of or >12 µM) the induction of cell death by fenretinide

Similar articles

Cited by

References

    1. Bartkowska K, Turlejski K, Djavadian RL. Neurotrophins and their receptors in early development of the mammalian nervous system. Acta Neurobiol Exp. 2010;70:454–467. - PubMed
    1. Widera D, Zander C, Heidbreder M, et al. Adult palatum as a novel source of neural crest-related stem cells. Stem Cells. 2009;27:1899–1910. - PMC - PubMed
    1. Cortazzo MH, Kassis ES, Sproul KA, Schor NF. Nerve growth factor (NGF)-mediated protection of neural crest cells from antimitotic agent-induced apoptosis. J Neurosci. 1996;16:3895–3899. - PMC - PubMed
    1. Yan C, Liang Y, Nylander KD, et al. p75-NGF as an antiapoptotic complex: independence vs. cooperativity. Mol Pharmacol. 2002;61:710–719. - PubMed
    1. Buhren J, Christoph AHA, Buslei R, et al. Expression of the neurotrophin receptor p75NTR in medulloblastomas is correlated with distinct histological and clinical features: evidence for a medulloblastoma subtype derived from the external granule cell layer. J Neuropathol Exp Neurol. 2000;59:229–240. - PubMed

Publication types

MeSH terms