Clinical Trial
. 2013 Apr;71(4):883-92.
doi: 10.1007/s00280-013-2079-z. Epub 2013 Jan 13.

A phase 2 study of KX2-391, an oral inhibitor of Src kinase and tubulin polymerization, in men with bone-metastatic castration-resistant prostate cancer

Affiliations
Clinical Trial

A phase 2 study of KX2-391, an oral inhibitor of Src kinase and tubulin polymerization, in men with bone-metastatic castration-resistant prostate cancer

Emmanuel S Antonarakis et al. Cancer Chemother Pharmacol. 2013 Apr.

Abstract

Purpose: KX2-391 is an oral non-ATP-competitive inhibitor of Src kinase and tubulin polymerization. In phase 1 trials, prostate-specific antigen (PSA) declines were seen in patients with advanced prostate cancer. We conducted a single-arm phase 2 study evaluating KX2-391 in men with chemotherapy-naïve bone-metastatic castration-resistant prostate cancer (CRPC).

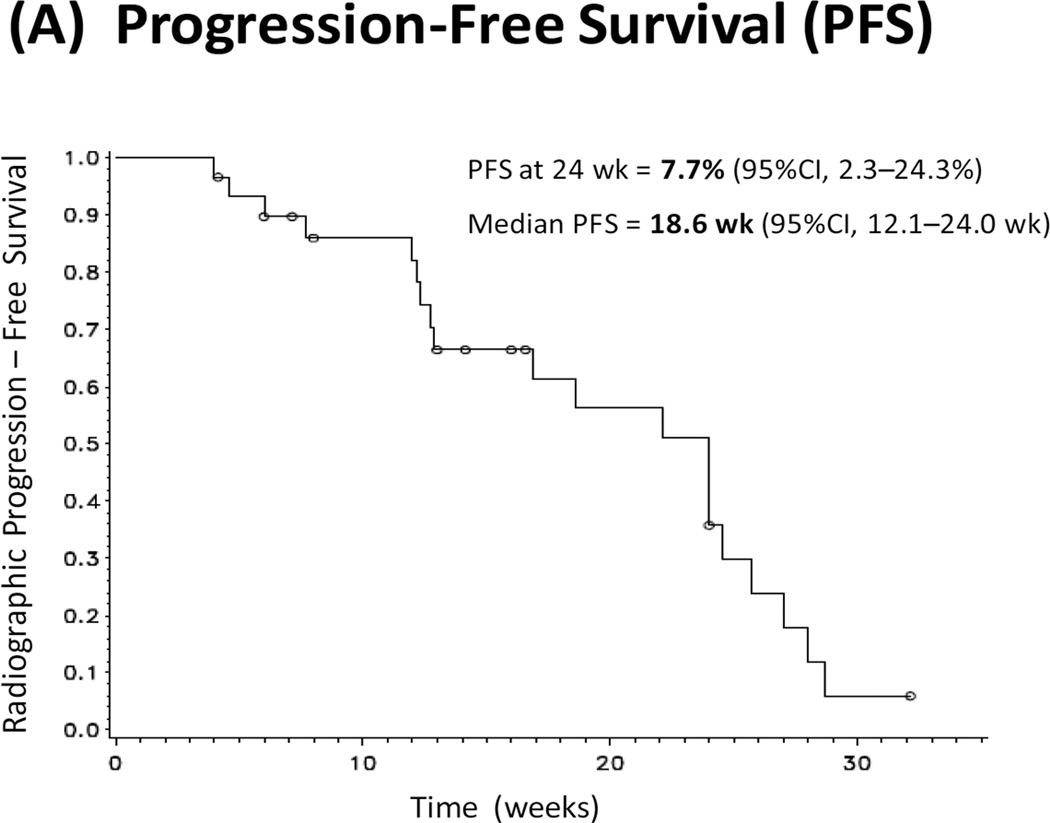
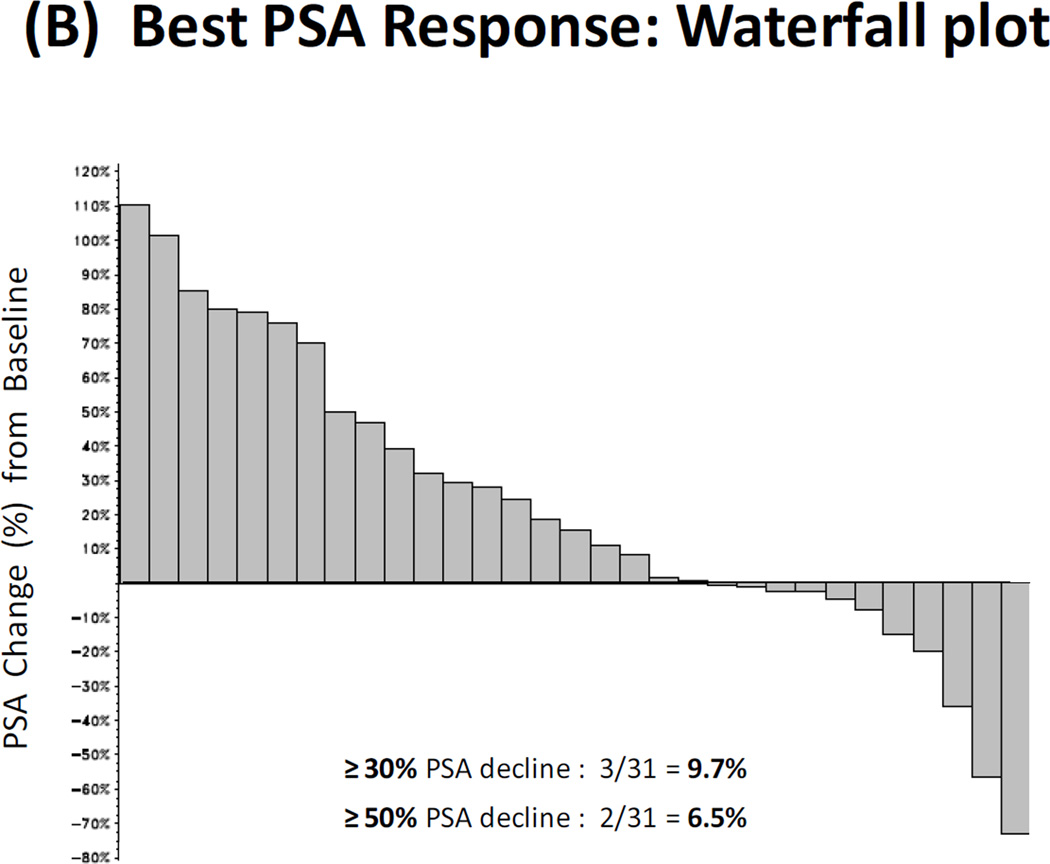
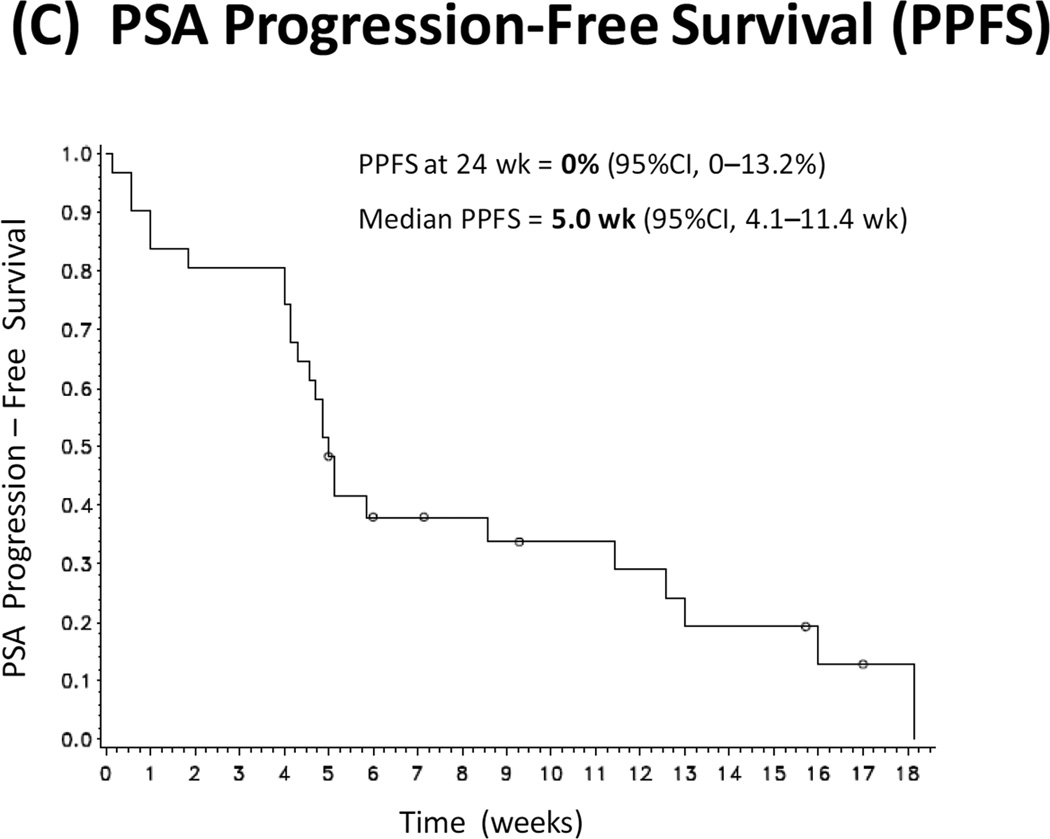
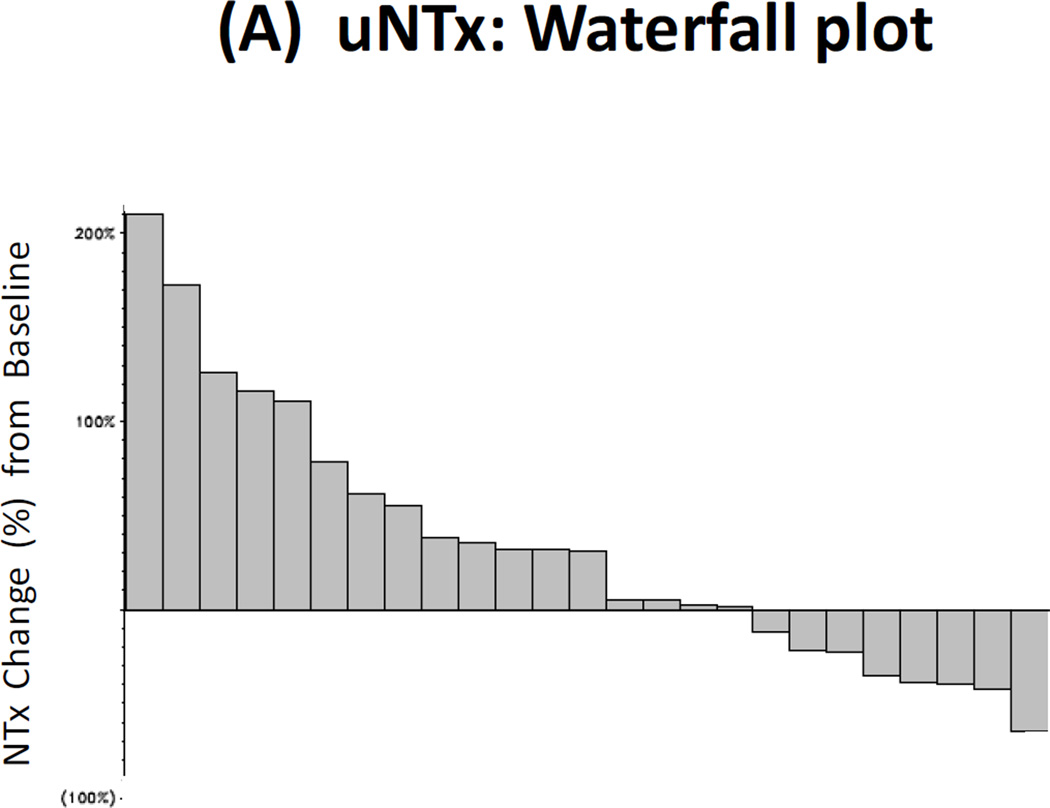
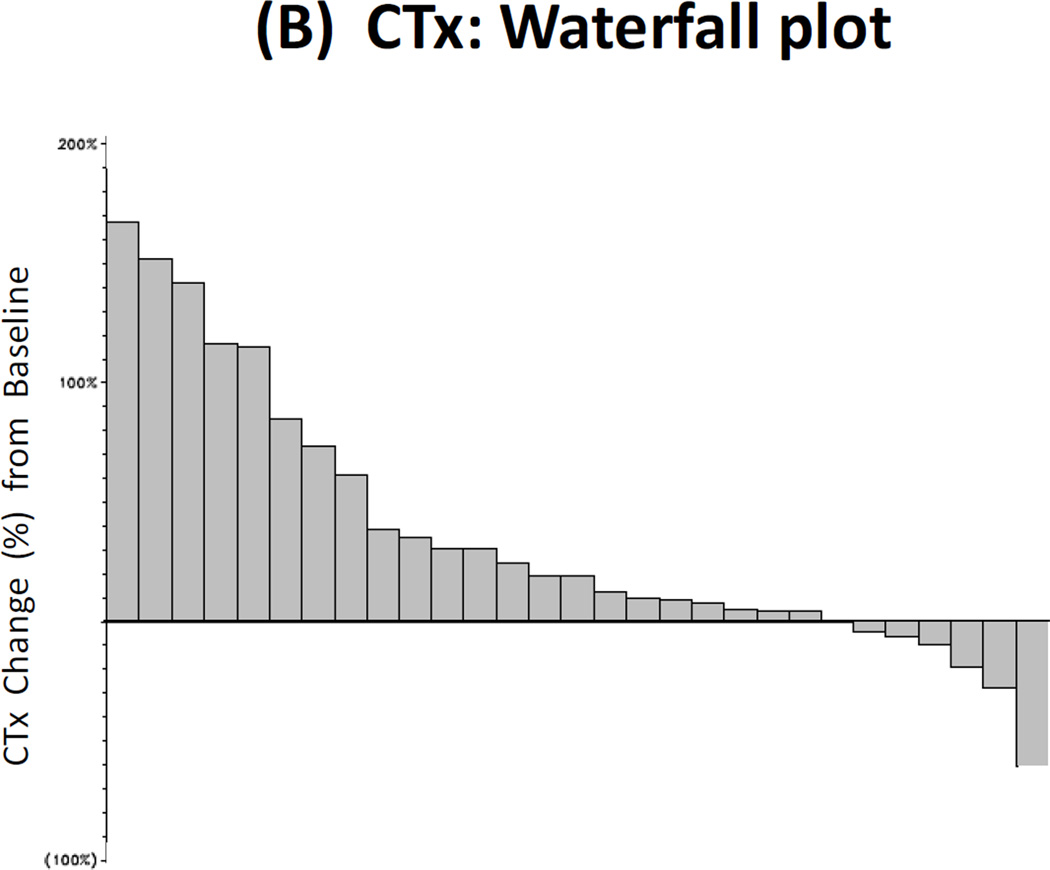
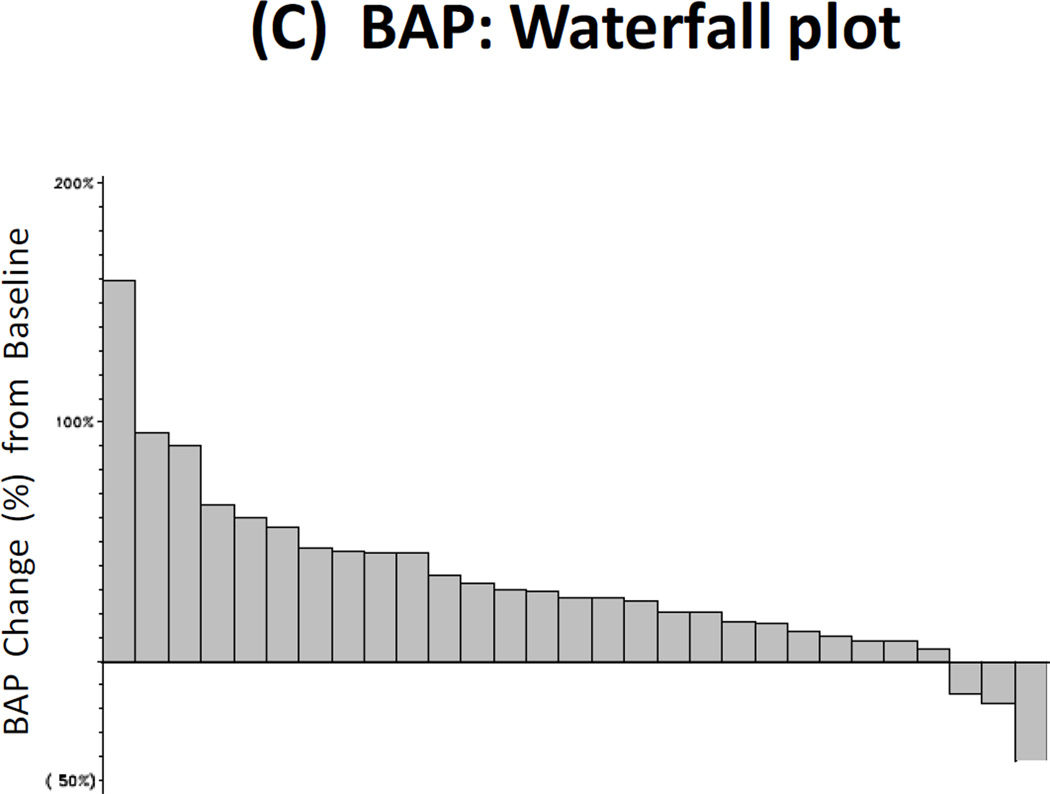
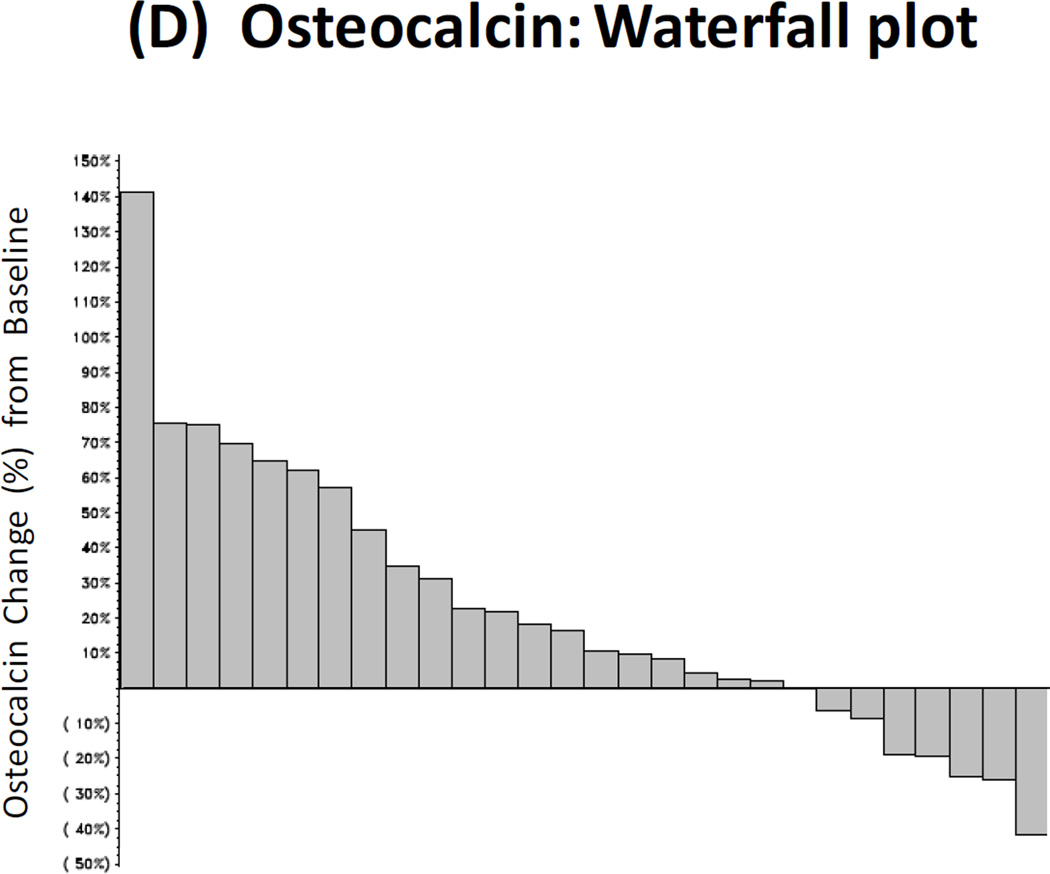
Methods: We treated 31 patients with oral KX2-391 (40 mg twice-daily) until disease progression or unacceptable toxicity. The primary endpoint was 24-week progression-free survival (PFS); a 50 % success rate was pre-defined as clinically significant. Secondary endpoints included PSA progression-free survival (PPFS) and PSA response rates. Exploratory outcomes included pharmacokinetic studies, circulating tumor cell (CTC) enumeration, and analysis of markers of bone resorption [urinary N-telopeptide (uNTx); C-telopeptide (CTx)] and formation [bone alkaline phosphatase (BAP); osteocalcin].

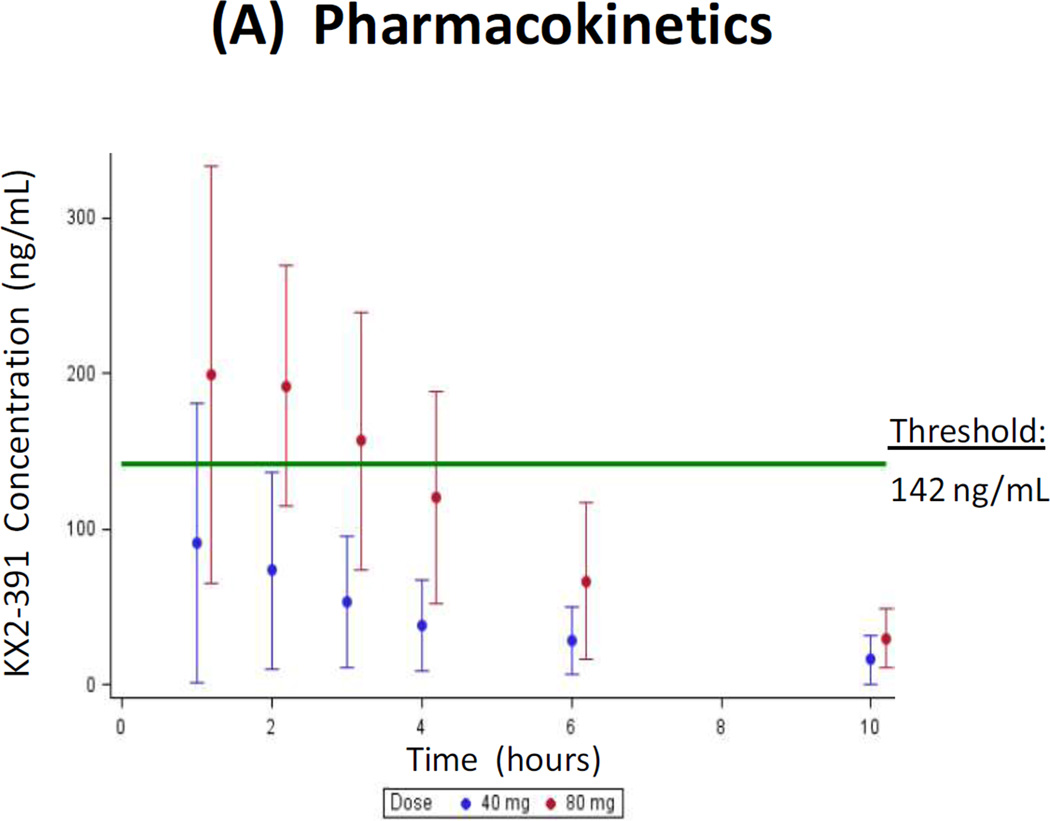
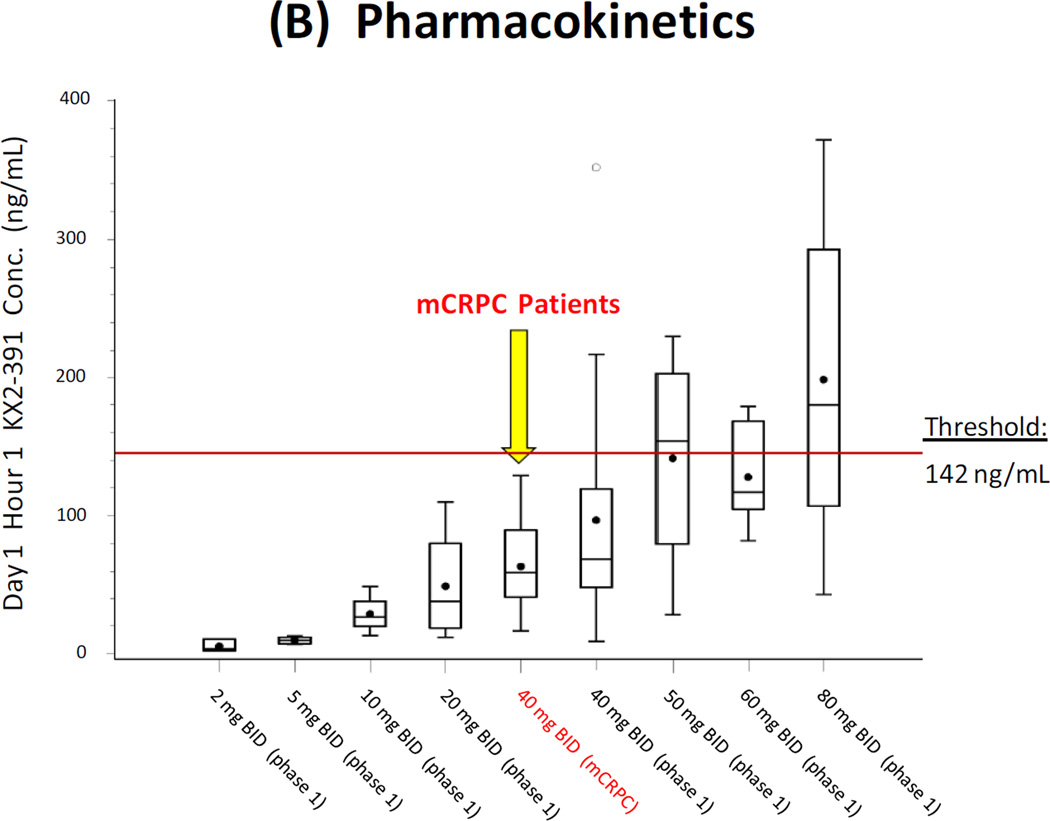
Results: The trial closed early after accrual of 31 patients, due to a pre-specified futility rule. PFS at 24 weeks was 8 %, and median PFS was 18.6 weeks. The PSA response rate (≥ 30 % decline) was 10 %, and median PPFS was 5.0 weeks. Additionally, 18 % of men with unfavorable (≥ 5) CTCs at baseline converted to favorable (<5) CTCs with treatment. The proportion of men with declines in bone turnover markers was 32 % for uNTx, 21 % for CTx, 10 % for BAP, and 25 % for osteocalcin. In pharmacokinetic studies, median C max was 61 (range 16-129) ng/mL, and median AUC was 156 (35-348) ng h/mL. Common toxicities included hepatic derangements, myelosuppression, fatigue, nausea, and constipation.

Conclusion: KX2-391 dosed at 40 mg twice-daily lacks antitumor activity in men with CRPC, but has modest effects on bone turnover markers. Because a C max of ≥142 ng/mL is required for tubulin polymerization inhibition (defined from preclinical studies), higher once-daily dosing will be used in future trials.


Conflict of interest statement

Conflicts of Interest: ESA, EIH, EMP, MRH, JYB, EYY, SYC, and GJF have no relevant conflicts of interest. GEW is a paid consultant/advisor for Kinex Pharmaceuticals. DHG is the Chief Scientific Officer of Kinex Pharmaceuticals, and has stock ownership in Kinex Pharmaceuticals. MRK is the Chief Medical Officer of Kinex Pharmaceuticals, and has stock ownership in Kinex Pharmaceuticals. LMD is the Vice President of Operations of Kinex Pharmaceuticals, and has stock ownership in Kinex Pharmaceuticals. MAC received research funding from Kinex Pharmaceuticals.

Figures

Figure 1
Figure 1. Clinical Outcomes
(A) Kaplan-Meier curve depicting radiographic progression-free survival (PFS). Progression is defined according to the PCWG2 criteria. (B) Waterfall plot showing best PSA response. Each bar represents the percentage change in PSA from baseline in an individual patient. (C) Kaplan-Meier curve depicting PSA progression-free survival (PPFS). PSA progression is defined as a confirmed ≥25% increase in PSA from nadir.
Figure 2
Figure 2. Bone Biomarker Outcomes
(A) Waterfall plot showing best treatment response in urinary N-telopeptide (uNTx), a marker of bone resorption. (B) Waterfall plot showing best treatment response in serum C-telopeptide (CTx), a marker of bone resorption. (C) Waterfall plot showing best treatment response in serum bone alkaline phosphatase (BAP), a marker of bone formation. (D) Waterfall plot showing best treatment response in serum osteocalcin, a marker of bone formation.
Figure 3
Figure 3. Pharmacokinetic Outcomes
(A) Pharmacokinetic results following the morning administration of KX2-391 at doses of 40 mg (current phase 2 study) and 80 mg (prior phase 1 study [14]; NCT00646139). Circles represent median values, and bars represent the range of values. The minimum plasma threshold thought to be required for tubulin polymerization inhibition is also depicted. (B) Summary of pharmacokinetic data from the current phase 2 trial and the prior phase 1 trial [14] (NCT00646139). Results are shown as box-and-whisker plots: the height of the box is the interquartile range (IQR), the horizontal line inside the box is the median, the circle inside the box is the mean, and the whiskers extend beyond the upper and lower quartiles by 1.5× IQR.

References

    1. Siegel R, Naishadham D, Jemal A. Cancer statistics, 2012 CA. Cancer J Clin. 2012;62:10–29. - PubMed
    1. Antonarakis ES, Eisenberger MA. Expanding treatment options for metastatic prostate cancer. N Engl J Med. 2011;364:2055–2058. - PMC - PubMed
    1. Hanahan D, Weinberg RA. Hallmarks of cancer: the next generation. Cell. 2011;144:646–674. - PubMed
    1. Chang YM, Kung HJ, Evans CP. Non-receptor tyrosine kinases in prostate cancer. Neoplasia. 2007;9:90–100. - PMC - PubMed
    1. Posadas EM, Al-Ahmadie H, Robinson VL, et al. FYN is overexpressed in human prostate cancer. BJU Int. 2009;103:171–177. - PMC - PubMed

Publication types

MeSH terms