. 2013 Apr;56(4):911-24.
doi: 10.1007/s00125-012-2809-5. Epub 2013 Jan 12.

ER stress signalling through eIF2α and CHOP, but not IRE1α, attenuates adipogenesis in mice

Affiliations

ER stress signalling through eIF2α and CHOP, but not IRE1α, attenuates adipogenesis in mice

J Han et al. Diabetologia. 2013 Apr.

Abstract

Aims/hypothesis: Although obesity is associated with endoplasmic reticulum (ER) stress and activation of the unfolded protein response (UPR) in adipose tissue, it is not known how UPR signalling affects adipogenesis. To test whether signalling through protein kinase RNA-like ER kinase/eukaryotic initiation factor 2 alpha (PERK/eIF2α) or inositol-requiring enzyme 1 alpha/X-box binding protein 1 (IRE1α/XBP1) is required for adipogenesis, we studied the role of UPR signalling in adipocyte differentiation in vitro and in vivo in mice.

Methods: The role of UPR signalling in adipogenesis was investigated using 3T3-L1 cells and primary mouse embryonic fibroblasts (MEFs) by activation or inhibition of PERK-mediated phosphorylation of the eIF2α- and IRE1α-mediated splicing of Xbp1 mRNA. Body weight change, fat mass composition and adipocyte number and size were measured in wild-type and genetically engineered mice fed a control or high-fat diet (HFD).

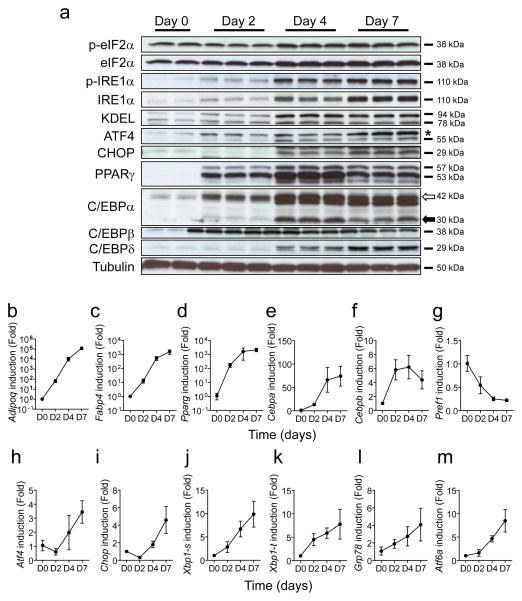
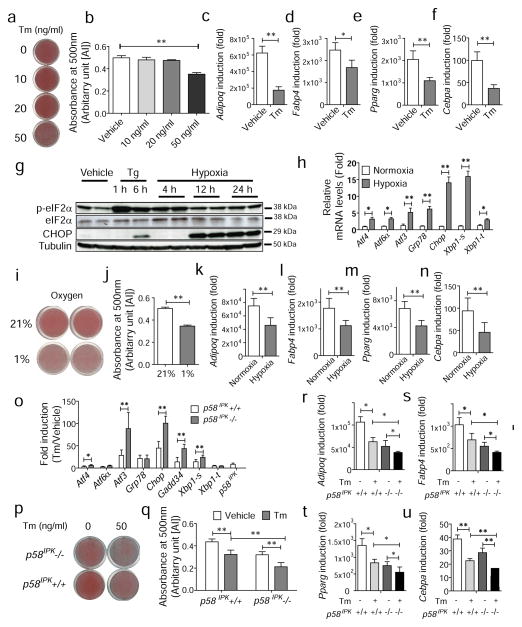
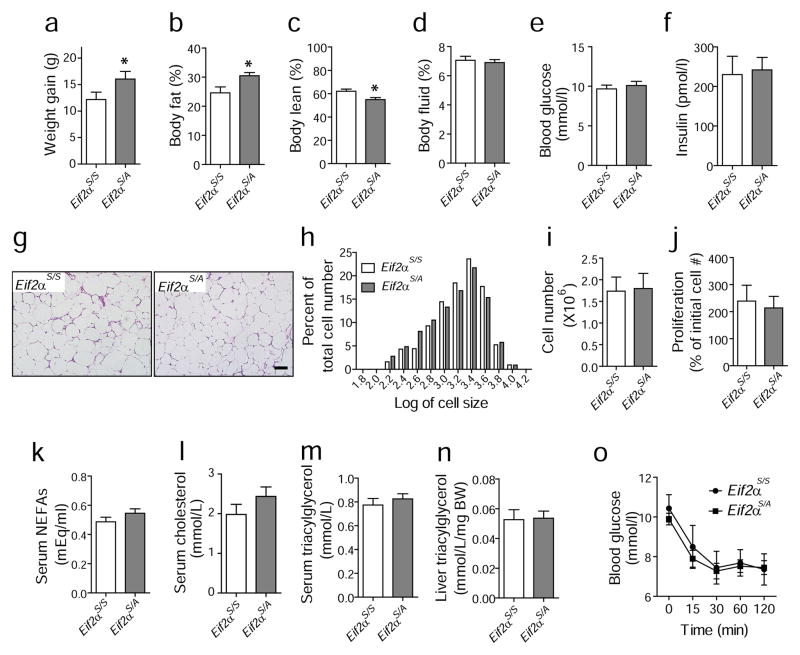
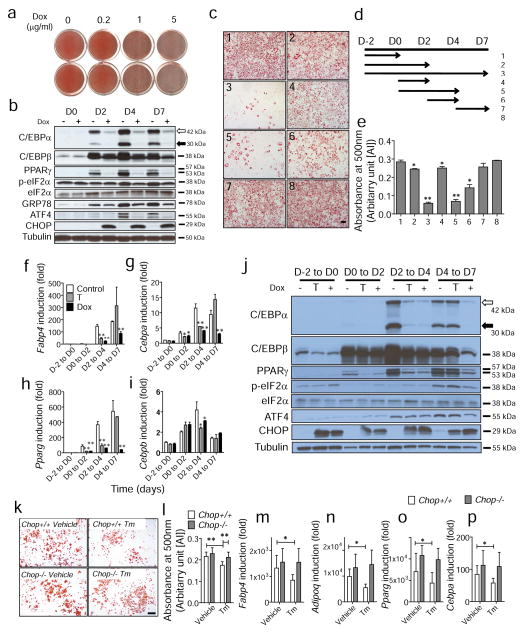
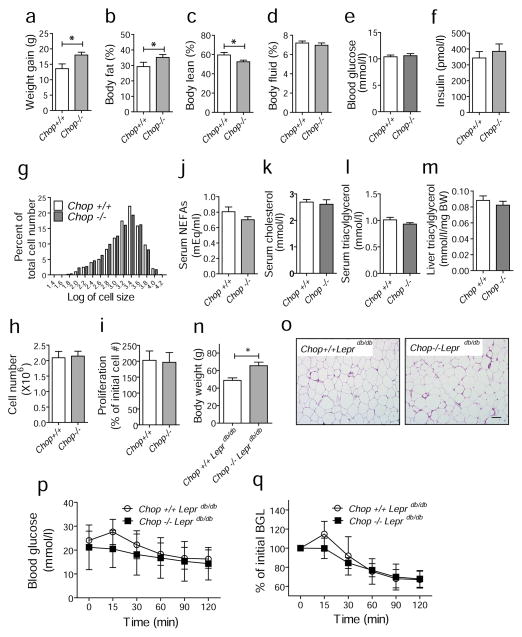
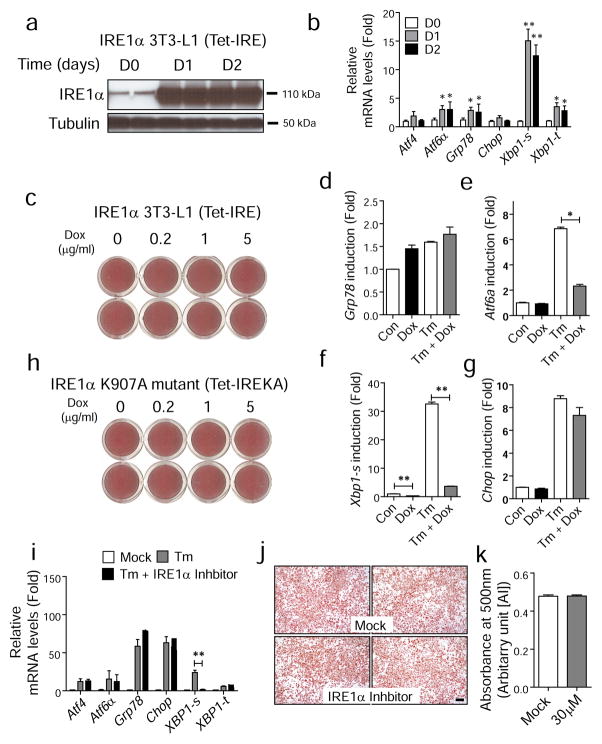
Results: ER stress repressed adipocyte differentiation in 3T3-L1 cells. Impaired eIF2α phosphorylation enhanced adipocyte differentiation in MEFs, as well as in mice. In contrast, increased eIF2α phosphorylation reduced adipocyte differentiation in 3T3-L1 cells. Forced production of CCAAT/enhancer binding protein (C/EBP) homologous protein (CHOP), a downstream target of eIF2α phosphorylation, inhibited adipogenesis in 3T3-L1 cells. Mice with deletion of Chop (also known as Ddit3) (Chop (-/-)) gained more fat mass than wild-type mice on HFD. In addition, Chop deletion in genetically obese Lepr (db/db) mice increased body fat mass without altering adipocyte size. In contrast to the eIF2α-CHOP pathway, activation or deletion of Ire1a (also known as Ern1) did not alter adipocyte differentiation in 3T3-L1 cells.

Conclusions/interpretation: These results demonstrate that eIF2α-CHOP suppresses adipogenesis and limits expansion of fat mass in vivo in mice, rendering this pathway a potential therapeutic target.


Conflict of interest statement

Duality of interest

The authors declare that there is no duality of interest associated with this manuscript.

Figures

Fig. 1
Fig. 1
Expression of ER stress genes is upregulated during adipogenesis in 3T3-L1 cells. (a) Protein expression profiles for adipocyte-related genes and UPR-related genes. Cell lysates were collected at the indicated times after the start of adipocyte differentiation and analysed by western blotting analysis. The white and black arrows indicate larger and smaller isoforms of C/EBPα (* indicates a non-specific band). p-eIF2α and p-IRE1α indicate phosphorylated forms of eIF2α and IRE1α, respectively. KDEL antibody can detect GRP78 and GRP94 proteins (bm) Gene expression profiles for adipocyte-related and UPR-related genes. Total RNA was isolated from 3T3-L1 cells at the indicated times during adipogenesis and mRNA levels were measured by quantitative real-time RT-PCR. Xbp1-s and Xbp1-t indicate spliced and total Xbp1, respectively. D0, D2, D4 and D7 indicate day 0, day 2, day 4 and day 7 after initiation of adipogenesis. Data are presented as means±SEM of three independent experiments with triplicates
Fig. 2
Fig. 2
ER stress suppresses adipogenesis in 3T3-L1 cells. (a, b) Suppression of adipocyte differentiation by tunicamycin (Tm) treatment. (a) Confluent 3T3-L1 cells were cultured in differentiation media in the presence of Tm at the indicated concentrations. On day 10, cells were fixed and stained with Oil red O. Representative images of Oil red O staining are shown. (b) Quantification of Oil red O staining in (a). **p<0.01 vs vehicle (cf) Gene expression profiles for markers of mature adipocytes. Total RNA was isolated from 3T3-L1 cells at the indicated times during adipogenesis in the absence or presence of Tm (50 ng/ml) and mRNA levels were measured by quantitative real-time RT-PCR. (gn) Suppression of adipogenesis by hypoxia. (g) Induction of eIF2α phosphorylation and CHOP production. Cell lysates were collected at the indicated times after hypoxic treatment and analysed by western blotting. Tg indicates thapsigargin at 300 nmol/l. (h) Gene expression profiles after hypoxic treatment for 24 h. Total RNA was isolated from 3T3-L1 cells at the indicated times during adipogenesis and mRNA levels were measured by quantitative real-time RT-PCR. White bar, normoxic conditions; grey bar, hypoxia. (i) Oil red O staining of 3T3-L1 cells after adipogenesis under normoxic (21%) or hypoxic (1%) conditions. (j) Quantification of Oil red O staining in (i). (kn) Gene expression profiles for markers of mature adipocytes under normoxic or hypoxic conditions. (ou) Suppression of adipogenesis by p58IPK deletion. (o) Gene expression profiles in p58IPK+/+ (white bars) or p58IPK−/− cells (grey bars) in the presence of Tm (1 μg/ml). Total RNA was isolated from p58IPK+/+ and p58IPK−/− pre-adipocytes at 24 h after treatment with Tm and mRNA levels were measured by quantitative real-time RT-PCR. Data were plotted as fold induction relative to the vehicle-treated sample. (p) Oil red O staining of p58IPK+/+ and p58IPK−/− MEFs after differentiation in the absence or presence of Tm (50 ng/ml). (q) Quantification of Oil red O staining in (p). White bars, vehicle; grey bars, Tm. (ru) Gene expression profiles for markers of mature adipocytes in p58IPK+/+ and p58IPK−/− MEFs in the absence or presence of Tm (50 ng/ml). Data are presented as means±SEM of three independent experiments with triplicates. *p<0.05, **p<0.01. AU, arbitrary units
Fig. 3
Fig. 3
eIF2α phosphorylation represses adipogenesis. (a) Protein expression profile in a stable 3T3-L1 cell line that expresses chimeric Fv2E-PERK. Cell lysates were collected at the indicated times after AP20187 treatment (5 nmol/l) for western blot analysis (* indicates a non-specific band). (b) Oil red O staining. Adipogenesis was stimulated in 3T3-L1 cells expressing Fv2E-PERK in the absence (vehicle) or presence of AP20187. On day 10, cells were fixed and stained with Oil red O. Representative images from indicated cell lines are shown. Scale bar indicates 100 μm. (c) Quantification of Oil red O staining in (b). (dg) Gene expression profiles for markers of mature adipocytes in Fv2E-PERK 3T3-L1 cells in the absence or presence of AP20187 (5 nmol/l). (h) Oil red O staining of Eif2aS/S and Eif2aA/A MEFs after adipogenesis. Differentiation was induced in primary MEFs from wild-type (Eif2aS/S) or homozygous mutant (Eif2aA/A) for 14 days. Cells were then fixed and stained with Oil red O. Representative images are shown and scale bar indicates 100 μm. (i) Quantification of Oil red O staining in (h). (jn) Gene expression profiles during adipocyte differentiation of primary MEFs. Total RNA was isolated from cells at the indicated times during adipogenesis, and mRNA levels were measured by quantitative real-time RT-PCR. Circles, Eif2aS/S; squares, Eif2aA/A. D0, D2, D4, D7, D10 indicate day 0, day 2, day 4, day 7 and day 10 after initiation of adipocyte differentiation. Data are presented as means±SEM of three independent experiments with triplicates. **p<0.01, *p<0.05 vs Eif2aA/A. AU, arbitrary units
Fig. 4
Fig. 4
Mice with mutation in eIF2α (Eif2aS/A) display increased body weight compared with wild-type Eif2aS/S mice without differences in adipocyte size or serum lipid levels. (af) Weight gain, body fat mass, body lean mass, fluid mass, blood glucose and insulin levels. Mice were fed an HFD for 13 weeks and metabolic variables were measured using an NMR-based analyser. Eif2aS/A (n=12) and Eif2aS/S (n=7). (g, h) No difference in adipocyte size between genotypes. After HFD for 13 weeks, epididymal fat tissues were obtained for histochemistry and representative images of epididymal fat pads are shown in (g). Scale bar indicates 100 μm. (h) Histogram shows the distribution of adipocyte size. The x-axis represents the logarithm of cell size in pixels, while the y-axis shows the percentage of cells having a given size for each group of mice. White bars, Eif2aS/S; grey bars, Eif2aS/A. (i) The number of cells from the SVF of adipose tissues from Eif2aS/A (n=4) and Eif2aS/S (n=4) mice at age of 6–8 weeks on a regular diet. (j) Proliferation rate of cells from SVF. Cells from SVF were plated in replicate and the number of cells was counted after 4 days of culture using an automated cell counter. Each suspension was counted twice. The y-axis represents the percentage of the initial cell number. Plasma levels of non-esterified NEFA (k), cholesterol (l) and triacylglycerol (m) after 13 weeks of HFD. Sera from Eif2aS/A (n=11) and Eif2aS/S (n=9) mice were collected and measured for NEFA and cholesterol as indicated in methods. (n) Hepatic triacylglycerol levels. Liver samples were collected for analysis after 13 weeks of HFD. (o) Insulin tolerance tests (ITTs). After 13 weeks of HFD, blood glucose levels were measured at the indicated times after insulin injection (0.75 U/kg body weight). Eif2aS/A (n=12, squares) and Eif2aS/S (n=9, circles). *p <0.05. BW, body weight
Fig. 5
Fig. 5
CHOP production inhibits adipogenesis in 3T3-L1 cells. (a) Inhibition of adipogenesis by CHOP. 3T3-L1 cells producing CHOP under the control of tetracycline-inducible promoter (Tet-CHOP) were differentiated in the presence of doxycycline (Dox) at various concentrations. On day 10, cells were fixed and stained with Oil red O. (b) Protein production profile during adipogenesis in the absence (−) or presence (+) of doxycycline. Cell lysates were collected at indicated time points and subjected to western blotting. D0, D2, D4 and D7 indicate day 0, day 2, day 4 and day 7 after initiation of adipocyte differentiation. The white and black arrows indicate larger and smaller isoforms of C/EBPα, respectively. (ce) Identification of critical time period for inhibitory effect of CHOP on adipogenesis. Adipocyte differentiation was stimulated in Tet-CHOP cells in the presence of doxycycline for various time intervals as indicated (d). On day 10, cells were stained with Oil red O and representative images from each condition are shown (c). Staining was quantified and presented as means ± SEM of three independent experiments with triplicates (e). Scale bar indicates 100 μm. (fj) Effect of transient CHOP overproduction on (fi) gene expression and (j) protein production during adipogenesis. Tet-CHOP cells were differentiated in the absence (white bars) or presence of doxycycline during the entire differentiation period (black bars) or transient doxycycline treatment (grey bars) as indicated. D–2 indicates 2 days before the adipocyte differentiation; D0, D2, D4 and D7 indicate day 0, day 2, day 4 and day 7 after initiation of adipogenesis. (fi) At the days indicated, total RNAs were isolated for analysis by real-time RT-PCR. Data are presented as means±SEM of three independent experiments with triplicates. *p<0.05 and **p<0.01 vs control. (j) Protein production was analysed by western blot under the same conditions as (fi). (k) Oil red O staining. Adipogenesis was stimulated in primary Chop+/+ and Chop−/− MEFs in the absence (vehicle) or presence of Tm (50 ng/ml). On day 10, cells were fixed and stained with Oil red O. Representative images from indicated MEF lines are shown. Scale bar indicates 100 μm. (l) Quantification of Oil red O staining in (k). White bars, Chop+/+; grey bars, Chop−/−. (mp) Gene expression profiles for markers of mature adipocytes in Chop+/+ (white bars) and Chop−/− MEFs (grey bars) in the absence or presence of Tm (50 ng/ml). *p<0.05 and **p<0.01. AU, arbitrary units
Fig. 6
Fig. 6
Chop deletion increases body fat mass in mice fed a HFD or in genetically obese Leprdb/db mice. (af) Weight gain, body fat mass, body lean mass, fluid mass, blood glucose and insulin levels. Chop+/+ (n=10) and Chop−/− (n=8) mice were fed an HFD for 13 weeks and weight gain, body fat mass, body lean mass and fluid mass were measured using an NMR-based analyser. (g) Histogram showing the distribution of adipocyte size in mice fed an HFD for 13 weeks. The x-axis represents the logarithm of cell size in pixels, while the y-axis shows the percentage of cells having a given size for each group of mice. White bars, Chop+/+; black bars, Chop−/−. (h) The number of cells from the SVF of adipose tissues from Chop+/+ (n=4) and Chop−/− (n=4) mice at the age of 6–8 weeks on regular diet. (i) Proliferation rate of cells from SVF. Cells from SVF were plated in replicate and the number of cells was counted after 4 days using an automated cell counter. Each suspension was counted twice. The y-axis represents the percentage of the initial cell number. Serum levels of NEFA (j), cholesterol (k) and triacylglycerol (l) from mice fed an HFD for 13 weeks. Sera from Chop+/+ (n=10) and Chop−/− (n=8) mice were collected and analysed. (m) Hepatic triacylglycerol levels. Liver samples were collected after 13 weeks of HFD for analysis. (n) Body weights of Chop+/+Leprdb/db (n=5) and Chop−/−Leprdb/db (n=5) mice at 6 months of age. (o) Representative images of epididymal fat pads from Chop+/+Leprdb/db and Chop−/−Leprdb/db mice at 6 months of age. Scale bar indicates 100 μm. (p, q) ITTs. Chop+/+Leprdb/db (n=5, circles) and Chop−/− Leprdb/db (n=5, squares) mice at 6 months of age were challenged with insulin (0.75 U/kg body weight) and blood glucose levels were measured. Data are presented as means±SEM. **p<0.01, *p<0.05. BW, body weight
Fig. 7
Fig. 7
IRE1α signalling is not required for adipogenesis in vitro or in vivo. (a, b) Generation of 3T3-L1 cells that produce wild-type IRE1α under the control of a tetracycline-inducible promoter (Tet-IRE). Total protein lysates and total RNA were collected at indicated time points after doxycycline (5 μg/ml) treatment and analysed by western blot (a) and quantitative real-time PCR (b). White bars, day 0 (D0); grey bars, day 1 (D1); black bars, day 2 (D2). **p<0.01, *p<0.05 vs D0. (c) IRE1α overproduction does not affect adipogenesis. Differentiation was induced in Tet-IRE cells in the presence of doxycycline (Dox) at various doses. On day 10, cells were stained with Oil red O. Representative images from each condition are shown. (dg) Gene expression profile for stable 3T3-L1 cells expressing dominant-negative mutant Ire1aK907A under the control of a tetracycline-inducible promoter (Tet-IREKA) in the absence or presence of Tm-induced ER stress. Data are presented as means±SEM of three independent experiments with triplicates. (h) Images of Oil red O staining for 3T3-L1 cells expressing mutant Ire1aK907A under the same conditions as (dg). (i) Quantitative real-time RT-PCR to verify IRE1α inhibition. 3T3-L1 cells were treated with Tm (2 μg/ml) in absence (grey bars) or presence of IRE1α inhibitor (30 μmol/l, black bars) for 16 h for analysis of gene expression. ‘Mock’ indicates DMSO treatment (white bars). (j) Oil red O staining. Adipogenesis was stimulated in 3T3-L1 cells in the absence (vehicle) or presence of IRE1α inhibitor (30 μmol/l). On day 10, cells were fixed and stained with Oil red O. Representative images are shown. Scale bar indicates 100 μm. (k) Quantification of Oil red O staining is shown in right panel. Data are presented as means±SEM. **p<0.01, *p<0.05. AU, arbitrary units

Similar articles

Cited by

References

    1. Barness LA, Opitz JM, Gilbert-Barness E. Obesity: genetic, molecular, and environmental aspects. Am J Med Genet A. 2007;143A:3016–3034. - PubMed
    1. Goossens GH. The role of adipose tissue dysfunction in the pathogenesis of obesity-related insulin resistance. Physiology & Behavior. 2008;94:206–218. - PubMed
    1. de Ferranti S, Mozaffarian D. The perfect storm: obesity, adipocyte dysfunction, and metabolic consequences. Clin Chem. 2008;54:945–955. - PubMed
    1. Faust I, Johnson P, Stern J, Hirsch J. Diet-induced adipocyte number increase in adult rats: a new model of obesity. Am J Physiol. 1978;235:E279–E286. - PubMed
    1. Rosen ED, MacDougald OA. Adipocyte differentiation from the inside out. Nat Rev Mol Cell Biol. 2006;7:885–896. - PubMed

Publication types

Substances

LinkOut - more resources