. 2013 Feb;15(2):179-88.
doi: 10.1038/ncb2661. Epub 2013 Jan 13.

SCFFbxw5 mediates transient degradation of actin remodeller Eps8 to allow proper mitotic progression

Affiliations

SCFFbxw5 mediates transient degradation of actin remodeller Eps8 to allow proper mitotic progression

Achim Werner et al. Nat Cell Biol. 2013 Feb.

Abstract

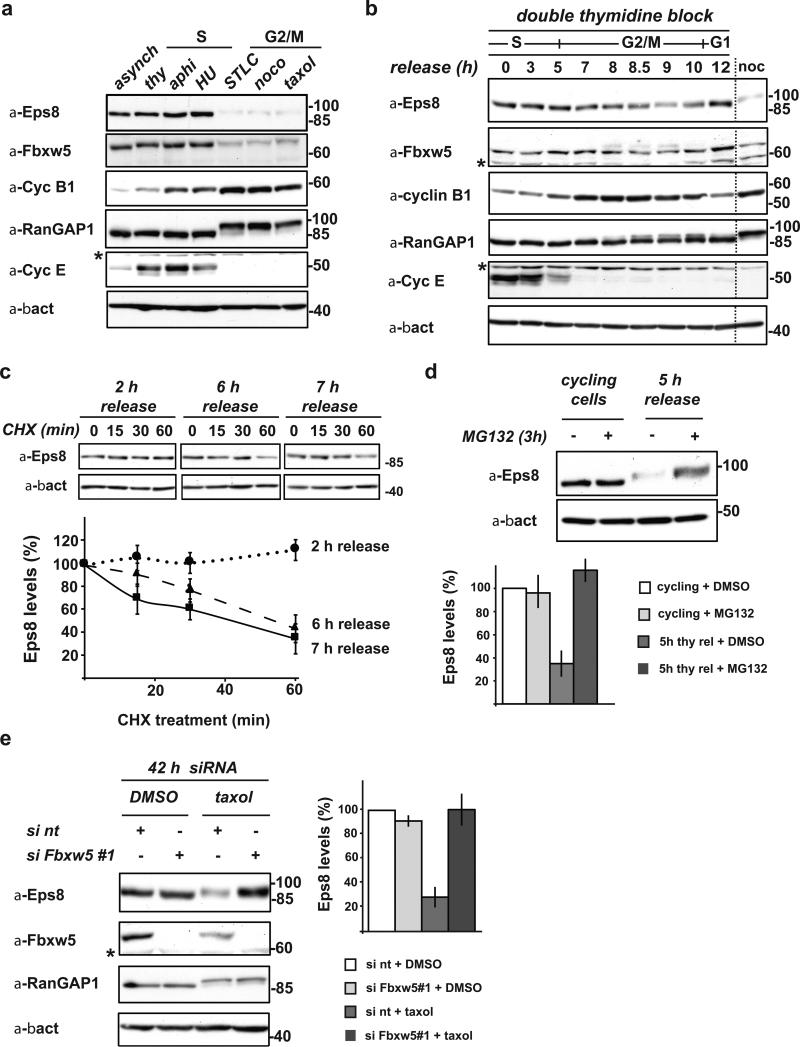
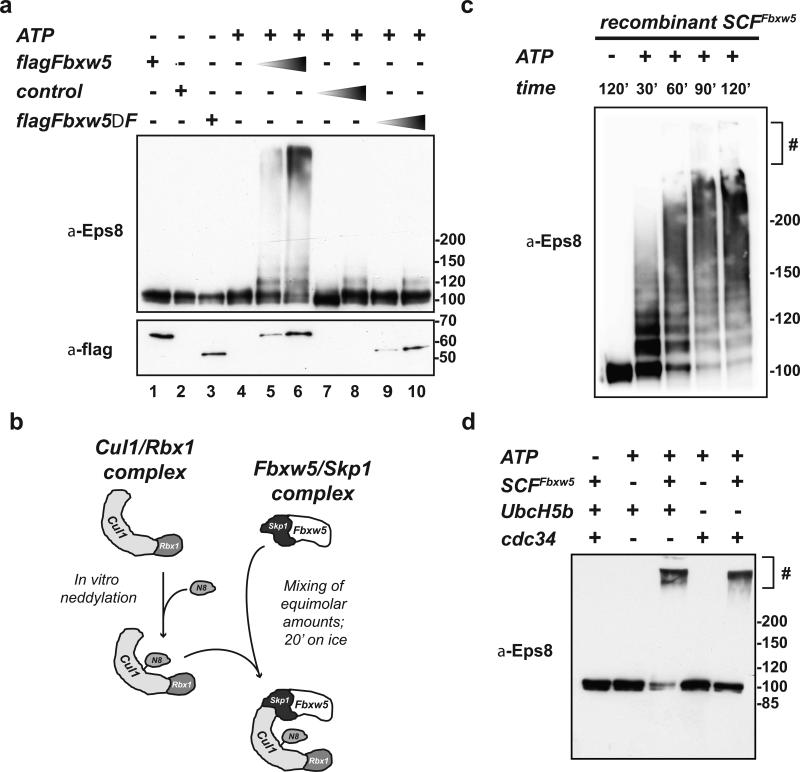
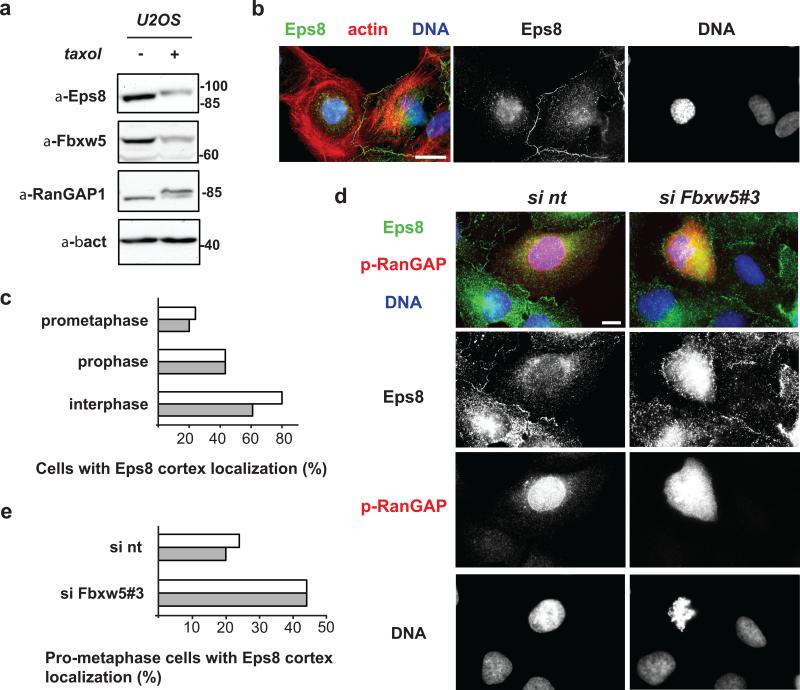
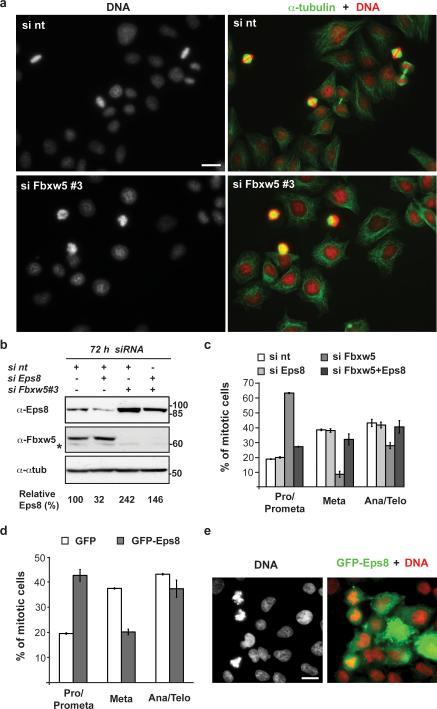
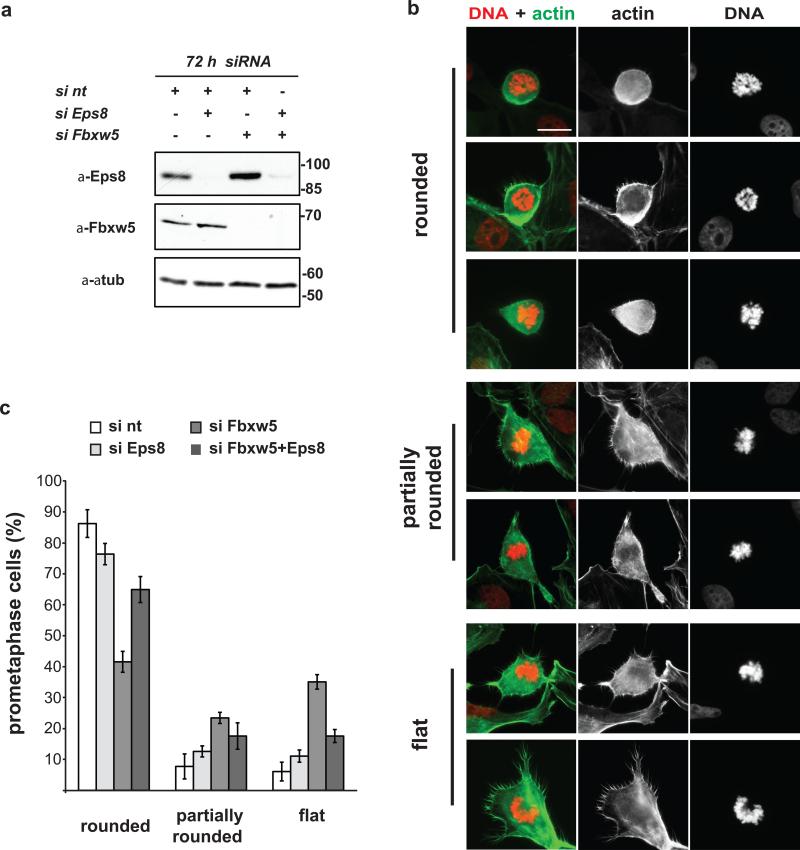
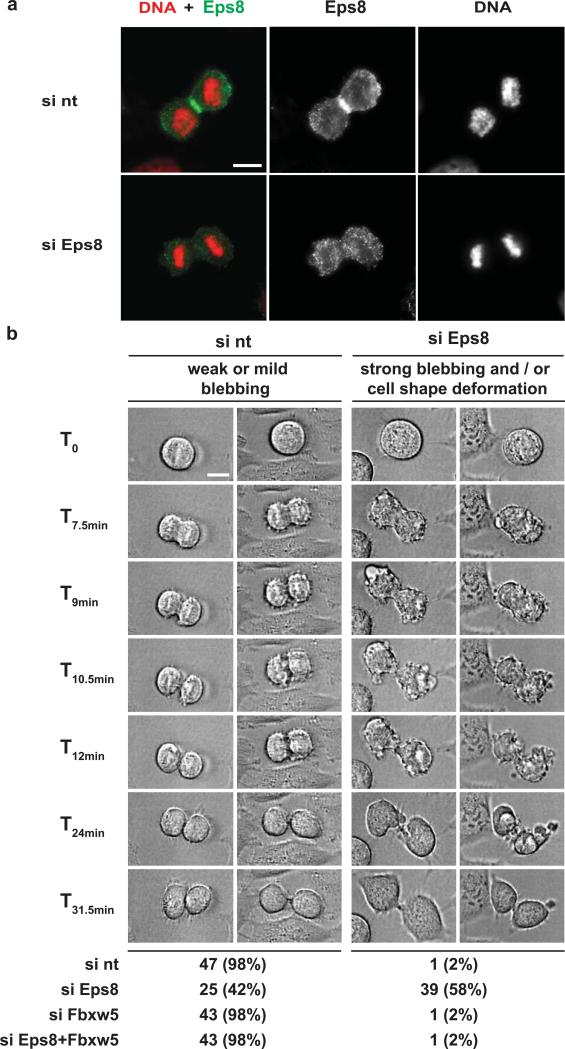
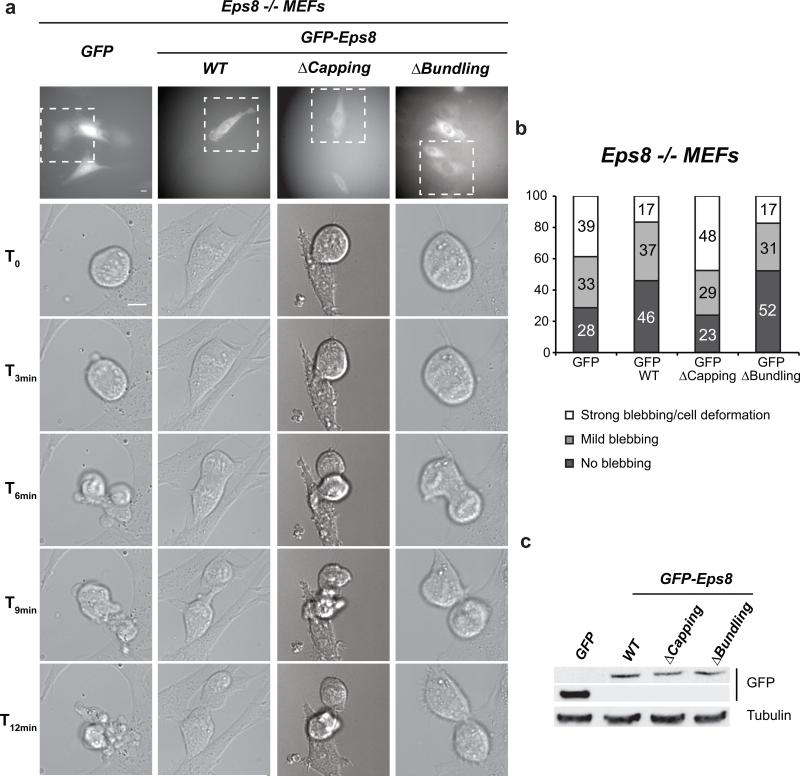
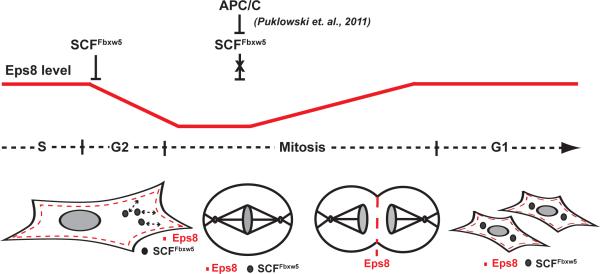
Eps8, a bi-functional actin cytoskeleton remodeller, is a positive regulator of cell proliferation and motility. Here, we describe an unrecognized mechanism regulating Eps8 that is required for proper mitotic progression: whereas Eps8 is stable in G1 and S phase, its half-life drops sharply in G2. This requires G2-specific proteasomal degradation mediated by the ubiquitin E3 ligase SCF(Fbxw5). Consistent with a short window of degradation, Eps8 disappears from the cell cortex early in mitosis, but reappears at the midzone of dividing cells. Failure to reduce Eps8 levels in G2 prolongs its localization at the cell cortex and markedly delays cell rounding and prometaphase duration. However, during late stages of mitosis and cytokinesis, Eps8 capping activity is required to prevent membrane blebbing and cell-shape deformations. Our findings identify SCF(Fbxw5)-driven fluctuation of Eps8 levels as an important mechanism that contributes to cell-shape changes during entry into-and exit from-mitosis.


Figures

FIGURE 1
FIGURE 1. Eps8 is a cell cycle regulated protein that undergoes Fbxw5-mediated proteasomal degradation specifically during G2/M
(a) Immunoblot analysis of exponentially growing (cycling), thymidine-, aphidocolin-, or hydroxurea-arrested (S-Phase), and STLC, nocodazole, or taxol-arrested HeLa cells (G2/M) with indicated antibodies. (b) HeLa cells were synchronized by a standard double thymidine block/release protocol. Samples were taken after indicated time periods and lysates analyzed by immunoblotting. For comparison, lysate of nocodazole-arrested cells (as in (a)) were loaded (noc). (c) HeLa cells were synchronized by a standard double thymidine block and released. After indicated time periods, cycloheximide (CHX) was added. Samples were taken at indicated time points after CHX addition, analyzed by immunoblotting. Eps8 levels were quantified relative to β-actin levels and plotted against time after addition of CHX. Eps8 levels at 0 min CHX were set to 100% (mean, +/- s.e.m. of three independent experiments). (d) Exponentially growing HeLa cells and cells released from a double thymidine block for 5 h were incubated with 20 μM MG132 or mock-treated with DMSO for 3 h. Eps8 levels were anaylzed by immunoblotting (top panel) and quantified relative to β-actin levels (bottom panel); relative Eps8 levels of mock-treated cells set to 100 (mean, +/- s.e.m. of three independent experiments). (e) Immunoblot analysis of HeLa cells transfected with non-targeting siRNA (si nt) or siFbxw5#1 for 42 h with indicated antibodies. 24 h after siRNA treatment, cells were treated with taxol or mock-treated with DMSO for 18 h. Eps8 levels were quantified relative to β-actin levels; relative Eps8 levels of control cells (si nt + DMSO) were set to 100 % (mean, +/- s.e.m. of three independent experiments). * cross-reactive band
FIGURE 2
FIGURE 2. Eps8 is a substrate of SCFFbxw5 in vitro
(a) In vitro ubiquitylation reaction of His-Eps8 (0.2 μM) with 75 μM His-Ubiquitin, 170 nM Ube1, 1 μM UbcH5b, and 5 mM ATP in the absence or presence of different amounts of control (= flag-IPs from non-transfected cells), flag-Fbxw5, and flag-Fbxw5ΔFbox immunoprecipitates at 30°C for 120 min. (b) For SCFFbxw5 reconstitution, mouse Fbxw5/Skp1 complexes were purified from bacteria (see material and methods) and Cul1/Rbx1 complexes were purified from E.coli using a ”split and co-express“ approach and in vitro neddylated as previously described, . For complex formation, both sub-complexes were mixed in equimolar amounts and incubated on ice for 20 min. (c) Time course of SCFFbxw5-dependent Eps8 ubiquitylation. 0.2 μM His-Eps8 was incubated with 75 μM His-Ubiquitin, 170 nM Ube1, 0.5 μM UbcH5b, 50 nM SCFFbxw5, and 5 mM ATP at 30°C. Reactions were stopped at indicated time points, and analyzed by immunoblotting. # stacking gel (d) In vitro ubiquitylation of His-Eps8 (0.2 μM) with 75 μM His-Ubiquitin, 170 nM Ube1, 1 μM UbcH5b or Cdc34, 5 mM ATP in the absence and presence of 150 nM reconstituted SCFFbxw5 at 30°C for 90 min.
FIGURE 3
FIGURE 3. Fbxw5 contributes to timely displacement of Eps8 from the cell cortex at the onset of mitosis
(a) Immunoblot analysis of exponentially growing or taxol-arrested U2OS cells with indicated antibodies. (b) U2OS cells were fixed and stained with anti-Eps8 antibodies, phalloidin, and Hoechst. Scale bar = 20 μm (c) U2OS cells were fixed and stained with anti-Eps8 and phospho-RanGAP1 antibodies and Hoechst. Random pictures were taken and interphase, prophase, and prometaphase cells were counted and classified according to Eps8 localization. The percentage of cells with Eps8 cortex localization is depicted (two independent experiments, 25 cells were analyzed per cell cycle state and experiment). (d) U2OS cells were treated with non-targeting siRNA (si nt) or siRNA targeting Fbxw5 (si Fbxw5#3) for 72 hours. Cells were fixed and stained with anti-Eps8 and anti-phospho-RanGAP1 antibodies and HOECHST. Scale bar = 10 μM. (e) U2OS cells were treated as in (c), random pictures were taken, and cells in prometaphase were counted and classified with respect to Eps8 localization. The percentage of cells showing cortex localization is shown (two independent experiments, 25 cells were analyzed per cell cycle state and experiment)
FIGURE 4
FIGURE 4. Fbxw5-mediated Eps8 degradation contributes to progression into metaphase
(a) HeLa cells were treated with non-targeting siRNA (si nt) or siRNAs targeting Fbxw5 (si Fbxw5 #3) for 72 h. Cells were fixed, stained with Hoechst and anti-α-tubulin antibodies. Scale bar = 20 μm. (b) Immunoblot analysis of HeLa cells transfected with different combinations of non-targeting siRNA (si nt) or siRNAs targeting Eps8 or Fbxw5#3 for 72 h with indicated antibodies. For each condition, final concentration of siRNAs was 10 nM. (c) HeLa cells were treated with siRNA as in (a), fixed, and stained with anti-α-tubulin and anti-γ-tubulin antibodies plus Hoechst. Random pictures were taken and mitotic cells were counted and classified into different mitotic stages. For pictures exemplifying mitotic stages refer to Supplementary Information Fig 5a. The percentage of different mitotic stages is shown (mean, +/- s.e.m. of three independent experiments, ~50 mitotic cells were counted per condition and experiment). (d) HeLa cells were transfected with GFP or GFP-Eps8, fixed, and stained with Hoechst. Random pictures were taken and GFP-positive, mitotic cells were counted and classified into different mitotic stages. The percentage of different mitotic stages is shown (mean +/- s.e.m. of three independent experiments, ~25 mitotic cells were counted per condition and experiment) (e) Representative image of GFP–Eps8-transfected HeLa cells of the experiment in d. Scale bar, 20 μm. Uncropped images of blots are shown in Supplementary Fig. S7.
FIGURE 5
FIGURE 5. Fbxw5-mediated Eps8 degradation contributes to timely cell rounding in early mitosis
(a) Immunoblot analysis of U2OS cells transfected with different combinations of non-targeting siRNA (si nt) or siRNAs targeting Eps8 or Fbxw5#3 for 72 h with indicated antibodies. For each condition, final concentration of siRNAs was 10 nM. (b) U2OS cells were treated with non-targeting siRNA (si nt) or siRNAs targeting Fbxw5 (si Fbxw5 #3) for 72 h. Cells were fixed, stained with Hoechst (DNA) and phalloidin (actin). Representative pictures of prometaphase cells are depicted. Scale bar = 20 μm (c) U2OS cells were treated as in (a) and fixed and stained with phalloidin and Hoechst. Random pictures of prometaphase cells were taken. Prometaphase cells were counted and classified according to cell shape. The percentage of rounded, partially rounded, and flat prometaphase cells is shown (mean, +/- s.e.m. of three independent experiments, ~25 prometaphase cells were counted per condition and experiment).
FIGURE 6
FIGURE 6. Failure to restore Eps8 levels induces membrane blebbing and cell shape deformation after metaphase in HeLa cells
(a) U2OS cells were treated with non-targeting siRNA (si nt) or siRNA targeting Eps8 (siEps8) for 72 hours. Cells were fixed and stained with anti-Eps8 antibodies and Hoechst. Scale bar = 10 μM. (b) Still images of differential interference contrast (DIC) time lapses of mitotic HeLa cells. Cells were synchronized by a double thymidine block/release protocol and transfected with different combinations of si nt, si Eps8, and si Fbxw5 #3. 60 h after transfection, DIC time lapses were started and performed for 12-14 h (time interval 1.5 min). Representative examples of cells undergoing mitosis from control cells (left two time lapses) or Eps8-depleted cells (right two time lapses) are shown. ~40-60 cells were recorded per condition and classified as indicated. Scale bar = 10 μm
FIGURE 7
FIGURE 7. MEF Eps8 -/- cells exhibit a post-metaphase membrane blebbing phenotype that can be rescued by re-expression of Eps8 versions with actin capping activity
(a) Still images of DIC time lapses of mitotic mouse embryo fibroblasts (MEFs). MEFs derived from Eps8 -/- mice and infected with either control pBABE-GFP vector (GFP) or pBABE-GFP-Eps8 WT, ΔCapping, or ΔBundling were seeded onto gelatine-coated coverslips at low confluency. The day after seeding, cells were subjected to time-lapse analysis (24 hours, time interval 2 minutes). 30 MEFs passaging through mitosis were recorded and classified per condition. Upper panels: fluorescence images taken immediately before the time-lapse. Lower panels: DIC images of the GFP-positive cells (white dashed line insets in upper panels) followed during mitosis. Bar = 10 μm. (b) Quantification of the experiment in (a). (c) Immunoblot analysis of expression levels of GFP-Eps8 versions in infected MEF Eps8 -/- cells. α-tubulin levels serve as loading control.
FIGURE 8
FIGURE 8
Model: SCFFbxw5 regulates Eps8 levels to control actin dynamics for proper mitotic progression

References

    1. Fazioli F, et al. Eps8, a substrate for the epidermal growth factor receptor kinase, enhances EGF-dependent mitogenic signals. EMBO J. 1993;12:3799–3808. - PMC - PubMed
    1. Di Fiore PP, Scita G. Eps8 in the midst of GTPases. Int J Biochem Cell Biol. 2002;34:1178–1183. - PubMed
    1. Disanza A, et al. Eps8 controls actin-based motility by capping the barbed ends of actin filaments. Nat Cell Biol. 2004;6:1180–1188. - PubMed
    1. Disanza A, et al. Regulation of cell shape by Cdc42 is mediated by the synergic actin-bundling activity of the Eps8-IRSp53 complex. Nat Cell Biol. 2006;8:1337–1347. - PubMed
    1. Scita G, et al. EPS8 and E3B1 transduce signals from Ras to Rac. Nature. 1999;401:290–293. - PubMed

Publication types

MeSH terms