. 2013 Mar;161(3):1458-75.
doi: 10.1104/pp.112.203299. Epub 2013 Jan 11.

Carbon and nitrogen provisions alter the metabolic flux in developing soybean embryos

Affiliations

Carbon and nitrogen provisions alter the metabolic flux in developing soybean embryos

Doug K Allen et al. Plant Physiol. 2013 Mar.

Abstract

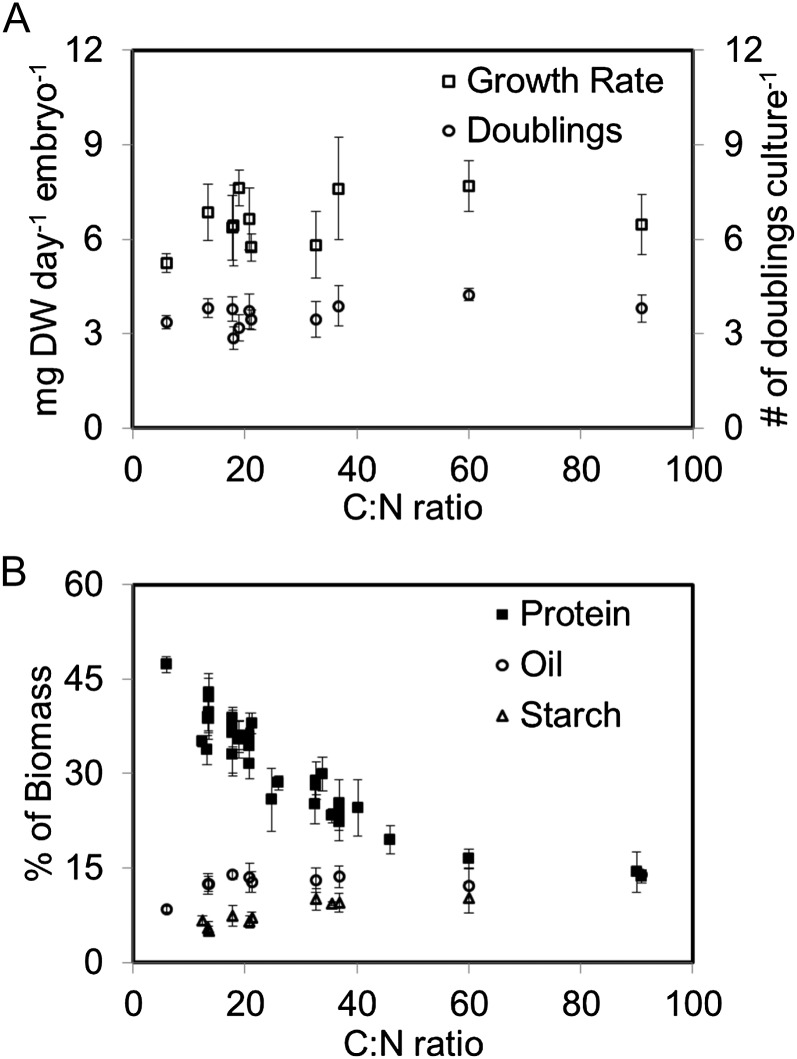
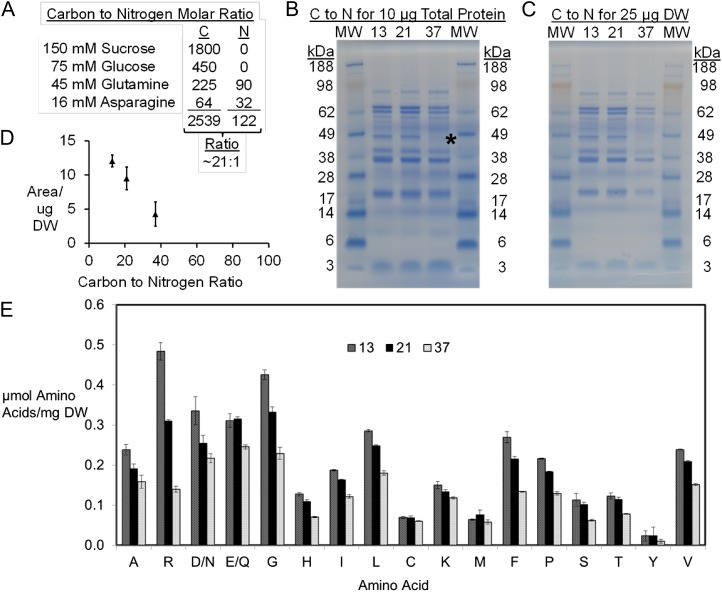
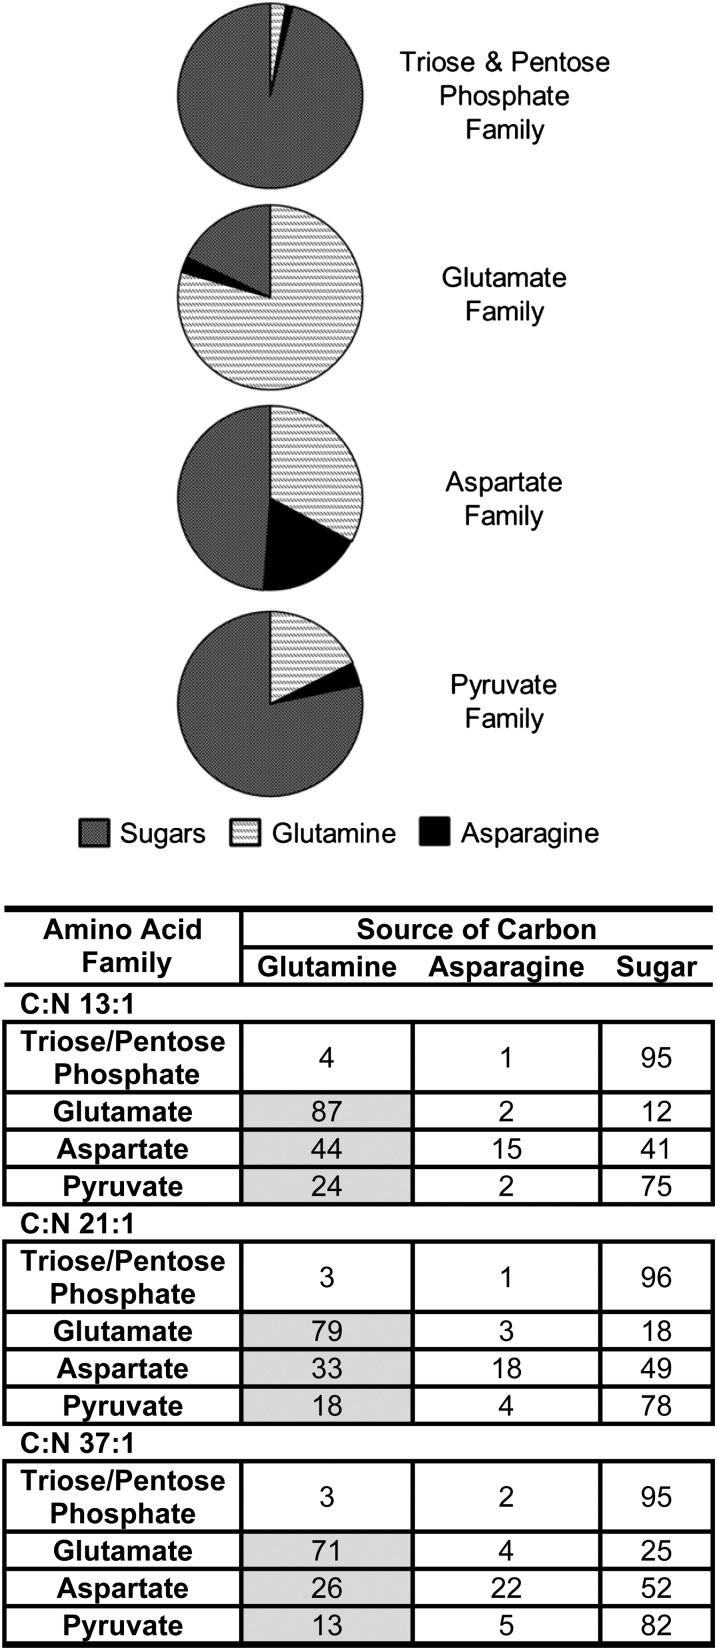
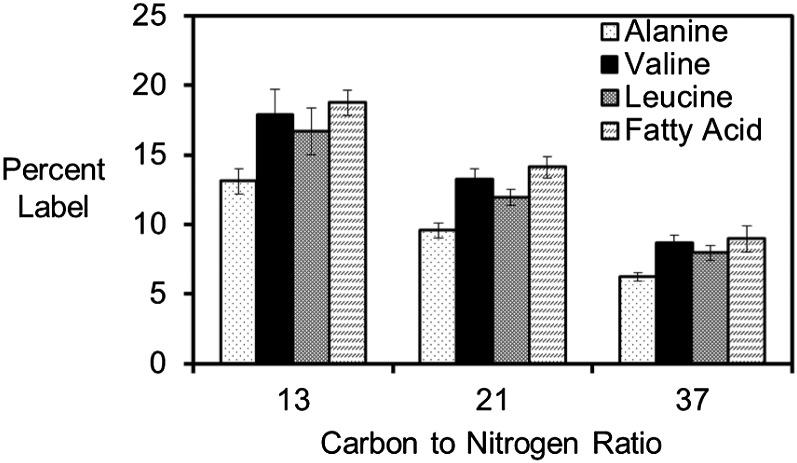
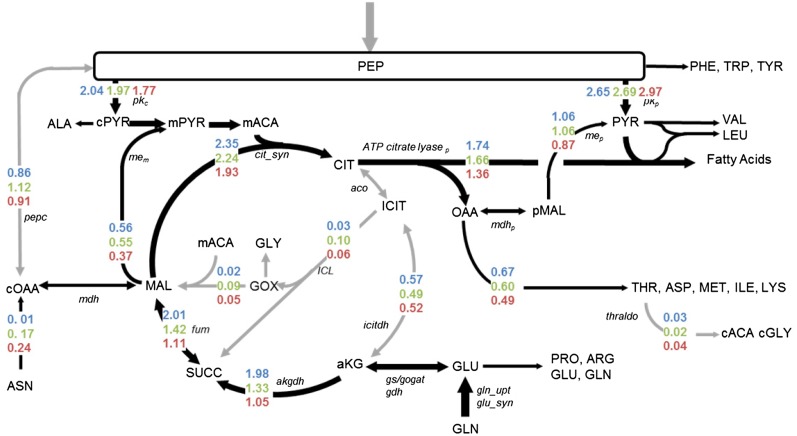
Soybean (Glycine max) seeds store significant amounts of their biomass as protein, levels of which reflect the carbon and nitrogen received by the developing embryo. The relationship between carbon and nitrogen supply during filling and seed composition was examined through a series of embryo-culturing experiments. Three distinct ratios of carbon to nitrogen supply were further explored through metabolic flux analysis. Labeling experiments utilizing [U-(13)C5]glutamine, [U-(13)C4]asparagine, and [1,2-(13)C2]glucose were performed to assess embryo metabolism under altered feeding conditions and to create corresponding flux maps. Additionally, [U-(14)C12]sucrose, [U-(14)C6]glucose, [U-(14)C5]glutamine, and [U-(14)C4]asparagine were used to monitor differences in carbon allocation. The analyses revealed that: (1) protein concentration as a percentage of total soybean embryo biomass coincided with the carbon-to-nitrogen ratio; (2) altered nitrogen supply did not dramatically impact relative amino acid or storage protein subunit profiles; and (3) glutamine supply contributed 10% to 23% of the carbon for biomass production, including 9% to 19% of carbon to fatty acid biosynthesis and 32% to 46% of carbon to amino acids. Seed metabolism accommodated different levels of protein biosynthesis while maintaining a consistent rate of dry weight accumulation. Flux through ATP-citrate lyase, combined with malic enzyme activity, contributed significantly to acetyl-coenzyme A production. These fluxes changed with plastidic pyruvate kinase to maintain a supply of pyruvate for amino and fatty acids. The flux maps were independently validated by nitrogen balancing and highlight the robustness of primary metabolism.


Figures

Figure 1.
Figure 1.
Variation in biomass growth and composition of developing soybean embryos from provision of altered amounts of carbon and nitrogen. The amount of biomass produced (A) and the percentage of storage in the forms of protein, oil, and starch (B) were measured across molar C:N ratios that varied from 6:1 to 91:1. Each point with error bars represents three to six separate culture replicates; in total, 184 cultures were examined. DW, Dry weight.
Figure 2.
Figure 2.
Fluxes to protein-derived amino acids. The protein composition and amino acid concentrations derived from protein were experimentally determined and used to calculate metabolic fluxes. A, Sample calculation for C:N ratio for the values described. B, Analysis of 10 μg of total protein by SDS-PAGE. The 48-kD missing band described in the text is highlighted by an asterisk. C, Analysis of 25 μg of biomass. D, Analysis of equivalent amounts of dry weight (DW) over increasing C:N ratios by gel densitometry analysis. E, Individual amino acid fluxes relative to the production of 1 mg of biomass.
Figure 3.
Figure 3.
Carbon source allocation into amino acid families. Provision of fully labeled substrates (Gln or Asn) resulted in the redistribution of label to amino acids and was used to establish the source of carbon for each amino acid family. Distribution of label to each amino acid along with carbon composition and corresponding biosynthetic fluxes were used to calculate the fractional contributions of different carbon sources to amino acids (for details, see Supplemental Data Set S4). Amino acids were grouped according to biosynthetic families by averaging. The results of the 21:1 C:N ratio culture are provided in the top panel, with the 13:1 and 37:1 C:N ratios that indicated similar trends provided in the table. The contributions of Gln-derived carbon to the Glu, Asp, and pyruvate amino acid families are highlighted by the shaded regions in the table.
Figure 4.
Figure 4.
Fatty acid synthesis utilizes Gln-derived carbon in soybeans. [U-13C5]Gln supplied to filling embryos resulted in pyruvate-derived metabolic products that were 13C labeled. The average proportion of labeled carbon was measured in pyruvate-derived amino acids and terminal acetate groups of fatty acids. The percentage of carbon labeled was similar between the two pyruvate-derived compound classes at each C:N ratio. The amount of incorporated carbon derived from Gln increases with decreasing C:N ratio.
Figure 5.
Figure 5.
Metabolic flux maps of developing soybean embryos supplied three different C:N ratios. The values have units of micromoles of metabolite per milligram dry weight produced. For easy visualization, arrows that are increased in thickness and darkness emphasize differences in fluxes. Colored numbers indicate the fluxes from the 13:1 (blue), 21:1 (green), and 37:1 (red) C:N ratios. Flux values that changed most significantly are provided in Table V, and a complete list of all fluxes, 95% CIs, and a flux map that includes metabolism into phosphoenolpyruvate is provided in Supplemental Data Set S7. Metabolite abbreviations are in uppercase letters, and key enzymes are indicated in italics.
Figure 6.
Figure 6.
Measured versus fitted data. The experimentally determined mass isotopomers were compared with the simulated values from metabolic flux analysis for each of the three flux maps. Measurements were in agreement, indicating that gross errors were not present and that the models were a reasonable description of metabolism.
Figure 7.
Figure 7.
13C label in Thr and Leu. [U-13C5]Gln was provided to developing embryos in different amounts to reflect three different C:N ratios (13:1, 21:1, 37:1). The mass isotopomer distribution in Thr and Leu, which are made from C4 dicarboxylic acids and acetyl-CoA, are presented. Labeling of all four carbons in Thr (i.e. [M+4]+) indicated a significant amount of labeling in organic acid precursors, such as malate and citrate. Leu was labeled in even-weighted mass isotopomers, indicating that these fractions were derived from acetyl-CoA, which was labeled in both carbons.
Figure 8.
Figure 8.
Alternative pathways for carbon import into plastids for amino and fatty acid biosynthesis. Development of the optimal model was the result of considering many network descriptions with the three combined labeling experiments for C:N of 37:1: A, Optimal model as described in the text. B, Export of malate. C, Export of citrate but with additional compartmentation of phosphoenolpyruvate and a hypothetical pyruvate transporter but without reversible isocitrate dehydrogenase. D, Optimal model plus inclusion of phosphoenolpyruvate compartmentation and a pyruvate transporter (cPYR→PYR is positive flux), which results in overfitting. The table includes the SSR of each model and the flux values for six key enzymes along with their CIs in brackets. cPYR, Cytosolic pyruvate; MAL, malate; cOAA, cytosolic oxaloacetate; aKG, α-ketoglutarate; CIT, citrate; PYR, plastidic pyruvate; pMAL, plastidic malate; CitSyn, citrate synthase; mep: plastidic malic enzyme; CitLys, citrate lyase; pPYRt, pyruvate transporter; cPK, cytosolic pyruvate kinase.

Similar articles

Cited by

References

    1. Adams CA, Broman TH, Rinne RW. (1982) Use of [3,4-C]glucose to assess in vivo competition for phosphoenolpyruvate between phosphoenolpyruvate carboxylase and pyruvate kinase in developing soybean seeds. Plant Cell Physiol 23: 959–965
    1. Adams CA, Rinne RW. (1981) Interactions of phosphoenolpyruvate carboxylase and pyruvic kinase in developing soybean seeds. Plant Cell Physiol 22: 1011–1021
    1. Allen DK, Laclair RW, Ohlrogge JB, Shachar-Hill Y. (2012) Isotope labelling of Rubisco subunits provides in vivo information on subcellular biosynthesis and exchange of amino acids between compartments. Plant Cell Environ 35: 1232–1244 - PMC - PubMed
    1. Allen DK, Libourel IGL, Shachar-Hill Y. (2009a) Metabolic flux analysis in plants: coping with complexity. Plant Cell Environ 32: 1241–1257 - PubMed
    1. Allen DK, Ohlrogge JB, Shachar-Hill Y. (2009b) The role of light in soybean seed filling metabolism. Plant J 58: 220–234 - PubMed

Publication types

MeSH terms