. 2013 Feb 15;190(4):1646-58.
doi: 10.4049/jimmunol.1202412. Epub 2013 Jan 11.

T cells home to the thymus and control infection

Affiliations

T cells home to the thymus and control infection

Claudia Nobrega et al. J Immunol. .

Abstract

The thymus is a target of multiple pathogens. How the immune system responds to thymic infection is largely unknown. Despite being considered an immune-privileged organ, we detect a mycobacteria-specific T cell response in the thymus following dissemination of Mycobacterium avium or Mycobacterium tuberculosis. This response includes proinflammatory cytokine production by mycobacteria-specific CD4(+) and CD8(+) T cells, which stimulates infected cells and controls bacterial growth in the thymus. Importantly, the responding T cells are mature peripheral T cells that recirculate back to the thymus. The recruitment of these cells is associated with an increased expression of Th1 chemokines and an enrichment of CXCR3(+) mycobacteria-specific T cells in the thymus. Finally, we demonstrate it is the mature T cells that home to the thymus that most efficiently control mycobacterial infection. Although the presence of mature T cells in the thymus has been recognized for some time, to our knowledge, these data are the first to show that T cell recirculation from the periphery to the thymus is a mechanism that allows the immune system to respond to thymic infection. Maintaining a functional thymic environment is essential to maintain T cell differentiation and prevent the emergence of central tolerance to the invading pathogens.


Figures

Figure 1
Figure 1. M. tuberculosis infection of the thymus
A. Bacterial burden in the lung, spleen and thymus after aerosol infection with M. tuberculosis. Data is pooled from eleven independent experiments each with 3 to 7 subjects per time point, for a total 97 subjects. Each dot represents one mouse, the solid line is the mean, and the dashed line is the lower detection limit. Number of thymocytes (B) and percentage of the main thymocyte populations (based on CD3, CD4 and CD8 expression) (C) after M. tuberculosis infection. Both infected (closed bars) and age-matched uninfected controls (open bars) are represented. *, p<0.05 by Mann-Whitney U test. Bars represent the mean ± SEM (n = 5 mice/group). Data is representative of two independent experiments.
Figure 2
Figure 2. An immune response is established in the thymus after mycobacteria infection
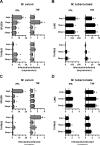
RNA expression levels were determined by qPCR (A, B) and protein concentration were determined by multiplex (C, D) in tissues of M. avium (A, C) and M. tuberculosis (B, D) infected mice. Bars refer to fold increase of infected mice in comparison to the average of uninfected mice and represent mean ± SEM (n = 4 to 8 mice/group). Data is representative of 2 to 3 independent experiments. *, p<0.05 by Mann-Whitney U test (statistics were performed by comparing uninfected with infected mice, before performing the ratio).
Figure 3
Figure 3. Mycobacteria-specific T cell responses are detected in the thymus after M. avium and M. tuberculosis infection
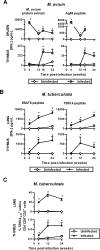
Cells from M. avium (A) or M. tuberculosis (B) infected mice were stimulated in vitro in the presence of M. avium protein extract or Ag85280-294 peptide (A) and ESAT61-20 or TB10.44-11 peptides (B). Age-matched uninfected mice were used as controls. Unstimulated and Concanavalin A or αCD3/αCD28 stimulated cultures were used as negative and positive controls of the in vitro stimulation, respectively (data not shown). IFNγ quantification in cell supernatants was performed by ELISA. C. TB10.4-specific CD8+ T cells were detected in lung and thymus of M. tuberculosis infected mice using the Kb/TB10.44-11 tetramer. Closed symbols represent infected mice and open symbols uninfected mice. Data points represent the mean ± SEM (n = 4 to 6 mice/group). Data is representative of two to four independent experiments. *, p<0.05 by Mann-Whitney U test.
Figure 4
Figure 4. Mycobacterial infection in the thymus is associated with increased iNOS expression
iNOS RNA expression levels were quantified by qPCR in tissues of M. avium (A) and M. tuberculosis (B) infected mice. Bars refer to fold increase of infected mice in comparison to the average of uninfected mice and represents the mean ± SEM (n=4 to 8 mice/group). Data is representative of 2 to 3 independent experiments. *, p<0.05 by Mann-Whitney U test (statistics were performed by comparing uninfected with infected mice, before performing the ratio). C, D. Representative medullary thymic sections of M. avium (C) and M. tuberculosis (D) infected thymi stained for iNOS (brown). Bacilli were detected by Ziehl-Neelsen staining. Shown are representative images obtained from the analysis of 3 to 5 thymi per time-point from of 2 to 3 independent experiments. Bar = 10μm.
Figure 5
Figure 5. M. avium-infected thymi contain T cells able to confer protection during infection
A. Schematic representation of the experiment. Thymic lobes from M. avium infected mice (24 wpi) or from uninfected WT mice were transplanted under the kidney capsule of TCRα KO receptor mice. Transplanted mice were infected 2 to 3 days post-transplant and sacrificed 4 and 8 weeks later. Non-transplanted TCRα KO mice were used as controls. Number of CD4+ T cells (B) and bacterial load (C) were assessed in the spleen. Each column represents mean ± SEM (n = 4 mice/group) from one of two experiments. *, p<0.05 by one-way ANOVA.
Figure 6
Figure 6. Mycobacteria-specific T cells recirculate to the thymus upon infection
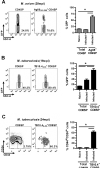
A. Total recirculating CD4SP cells from the thymi of naïve or M. avium-infected RAG-GFP mice and recirculating CD4SP Ag85-specific cells from the thymi of infected mice were enumerated. Represented are density plots of the expression of the GFP marker in total CD4SP cells (left) and in CD4SP Ag85+ cells (right). B. Total recirculating CD8SP cells from the thymi of naïve or M. tuberculosis-infected RAG-GFP mice and recirculating CD8SP TB10.4-specific cells from the thymi of infected mice were enumerated. Represented are density plots of the expression of the GFP marker in total CD8SP cells (left) and in CD8SP TB10.4+ cells (right). C. In WT mice, using the surface markers CD44 and CD24, total recirculating CD8SP cells and recirculating CD8SP TB10.4-specific cells from the thymi of infected mice were enumerated. Represented are density plots of the expression of CD44 and CD24 in total CD8SP cells (left) and in CD8SP TB10.4+ cells (right). All represented dot plots show concatenated data from all animals of the group. Bars represent mean ± SEM. Data is pooled from 2 to 3 independent experiments, with 5 to 8 mice/group. *, p<0.05 by one-way ANOVA.
Figure 7
Figure 7. Recirculation of mycobacteria-specific T cells into infected thymi correlates with increased Th1 recruiting chemokines and their cognate receptors
RNA expression (A, B) and protein concentration (C) were determined in tissues of M. avium (A) and M. tuberculosis (B, C) infected mice. Bars refer to fold increase of infected mice in comparison to the average of uninfected mice and represents mean ± SEM (n = 4 to 8 mice/group). Data is representative of 2 to 3 independent experiments. *, p<0.05 by Mann-Whitney U test (statistics were performed by comparing uninfected with infected mice, before performing the ratio). D. FACS plot of CXCR3 expression in thymic CD8SP TB10.4 and CD8SP TB10.4+ cells from M. tuberculosis-infected mice. Represented is the concatenated data from 3 mice analyzed. Gating strategy is depicted in Supplementary figure 1. E. Percentage of CXCR3 expressing cells between CD8SP TB10.4 and CD8SP TB10.4+ cells in M. tuberculosis-infected mice. Each bar represents mean ± SEM (n = 4 to 8 mice/group). Data is representative of 2 to 3 independent experiments. F. CXCR3 expression by donor CD4SP and CD8SP in the spleen and thymus. T cells from M. tuberculosis-infected CD45.2 mice were transferred to M. tuberculosis-infected CD45.1 recipient mice, and their CXCR3 expression was analyzed the next day. See Supplementary Figure 2 for scheme and gating strategy. Each bar represents mean ± SEM (n = 3 mice). Data is representative of 3 independent experiments. *, p<0.05 by one-way ANOVA.
Figure 8
Figure 8. Thymic recirculating T cells from M. avium-infected mice efficiently confer protection to infection
20 weeks after M. avium infection, RAG-GFP mice were sacrificed and their thymi and spleens removed. Spleen CD4+CD3+ cells, thymic CD3+CD4+CD8GFPCD24lo(recirculating) cells and thymus CD3+CD4+CD8GFPint cells were sorted and 4 to 4.2×10⁵ cells (depending on the experiment) were transferred to TCRα KO mice one day after M. avium infection. Mice were sacrificed 8 weeks post-transfer. Non-transplanted TCRα KO mice were used as controls. A. Purity of the transferred thymic populations. Thymic cell suspensions were depleted of CD8+ cells (top panels); and CD3+CD4+CD8GFPint (middle panels) and CD3+CD4+CD8GFPCD24lo (bottom panels) cells populations were sorted. B. Schematic representation of the experiment. C. Number of spleen CD4+ T cells (left panel) and bacterial load in the spleen (middle panel) and liver (right panel) were assessed. Each column represents mean ± SEM (n = 4 to 9 mice/group) from two combined independent experiments. *, p<0.05 by one-way ANOVA.

Comment in

References

    1. Boehm T. Design principles of adaptive immune systems. Nat Rev Immunol. 2011;11:307–317. - PubMed
    1. Hsu E. The invention of lymphocytes. Curr Opin Immunol. 2011;23:156–162. - PMC - PubMed
    1. Moran AE, Hogquist KA. T-cell receptor affinity in thymic development. Immunology. 2012;135:261–267. - PMC - PubMed
    1. Aloj G, Giardino G, Valentino L, Maio F, Gallo V, Esposito T, Naddei R, Cirillo E, Pignata C. Severe combined immunodeficiences: new and old scenarios. Int Rev Immunol. 2012;31:43–65. - PubMed
    1. Lynch HE, Goldberg GL, Chidgey A, Van den Brink MR, Boyd R, Sempowski GD. Thymic involution and immune reconstitution. Trends Immunol. 2009;30:366–373. - PMC - PubMed

Publication types

MeSH terms