. 2013 Apr;20(2):135-50.
doi: 10.1093/dnares/dss039. Epub 2013 Jan 11.

Evaluation of codon biology in citrus and Poncirus trifoliata based on genomic features and frame corrected expressed sequence tags

Affiliations

Evaluation of codon biology in citrus and Poncirus trifoliata based on genomic features and frame corrected expressed sequence tags

Touqeer Ahmad et al. DNA Res. 2013 Apr.

Abstract

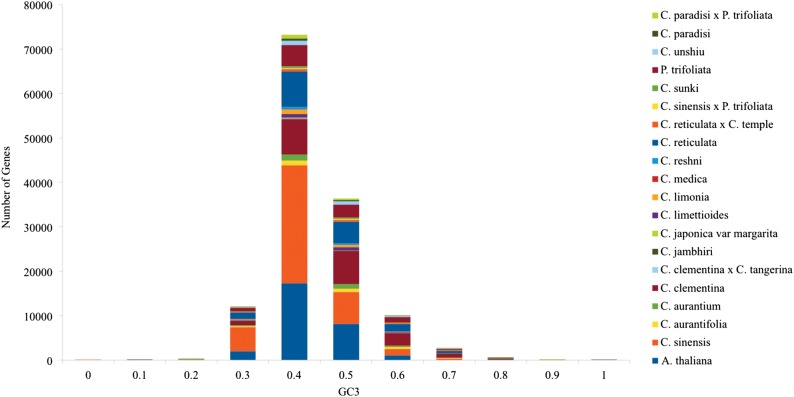
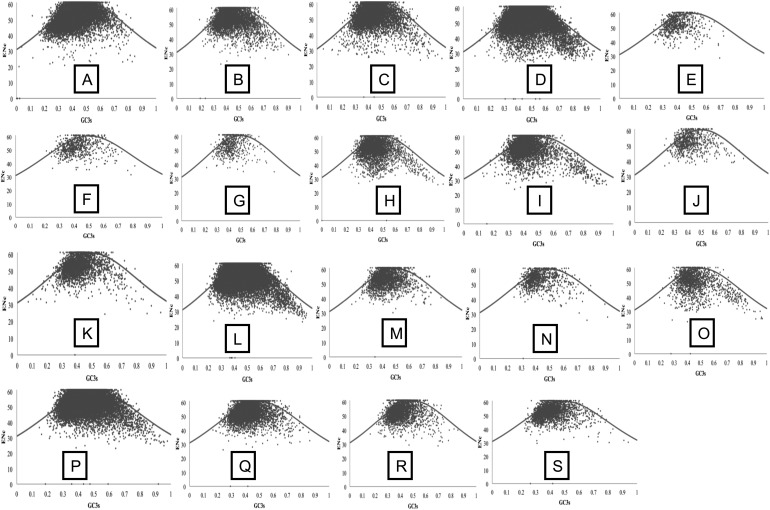
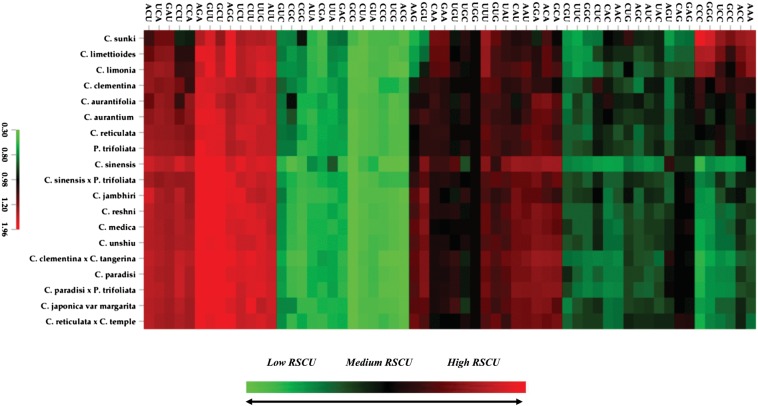
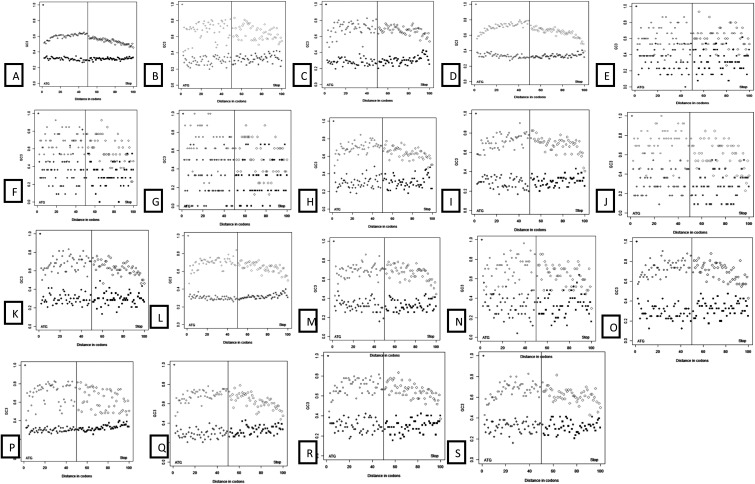
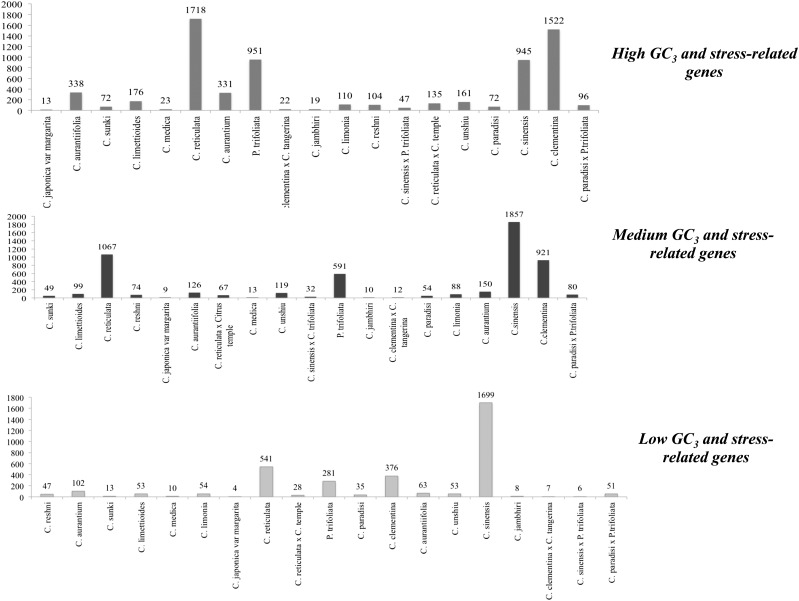
Citrus, as one of the globally important fruit trees, has been an object of interest for understanding genetics and evolutionary process in fruit crops. Meta-analyses of 19 Citrus species, including 4 globally and economically important Citrus sinensis, Citrus clementina, Citrus reticulata, and 1 Citrus relative Poncirus trifoliata, were performed. We observed that codons ending with A- or T- at the wobble position were preferred in contrast to C- or G- ending codons, indicating a close association with AT richness of Citrus species and P. trifoliata. The present study postulates a large repertoire of a set of optimal codons for the Citrus genus and P. trifoliata and demonstrates that GCT and GGT are evolutionary conserved optimal codons. Our observation suggested that mutational bias is the dominating force in shaping the codon usage bias (CUB) in Citrus and P. trifoliata. Correspondence analysis (COA) revealed that the principal axis [axis 1; COA/relative synonymous codon usage (RSCU)] contributes only a minor portion (∼10.96%) of the recorded variance. In all analysed species, except P. trifoliata, Gravy and aromaticity played minor roles in resolving CUB. Compositional constraints were found to be strongly associated with the amino acid signatures in Citrus species and P. trifoliata. Our present analysis postulates compositional constraints in Citrus species and P. trifoliata and plausible role of the stress with GC3 and coevolution pattern of amino acid.


Figures

Figure 1.
Figure 1.
The distribution of GC3 content in Citrus species, P. trifoliata and A. thaliana genes. The GC3 content showed unimodal distribution.
Figure 2.
Figure 2.
Nc versus GC3s plot of Citrus species and P. trifoliata genes. The solid black line indicates the expected Nc value, if the codon bias is only due to GC3s. Species order: A = C. sinensis; B = C. aurantifolia; C = C. aurantium; D = C. clementina; E = C. clementina × C. tangerina; F = C. jambhiri; G = C. japonica var. margarita; H = C. limettioides; I = C. limonia; J = C. medica; K = C. reshni; L = C. reticulata; M = C. reticulata × C. temple; N = C. sinensis × P. trifoliata; O = C. sunki; P = P. trifoliata; Q = C. unshiu; R = C. paradisi; and S = C. paradisi × P. trifoliata.
Figure 3.
Figure 3.
Heat map of the average RSCU of the 59 degenerate codons in the Citrus species and P. trifoliata using Euclidean distance and average linkage clustering module.
Figure 4.
Figure 4.
GC3 gradient across Citrus species and P. trifoliata. Species order: A = C. sinensis; B = C. aurantifolia; C = C. aurantium; D = C. clementina; E = C. clementina × C. tangerina; F = C. jambhiri; G = C. japonica var. margarita; H = C. limettioides; I = C. limonia; J = C. medica; K = C. reshni; L = C. reticulata; M = C. reticulata × C. temple; N = C. sinensis × P. trifoliata; O = C. sunki; P = P. trifoliata; Q = C. unshiu; R = C. paradisi; and S = C. paradisi × P. trifoliata. These plots show gradients of GC3 for 5% of GC3-rich and GC3-poor genes for all analysed genomes. Gradients from 5′ and 3′ ends of the CDS are shown in the same plot, separated by a vertical line. For all genomes, GC3-rich genes become more GC3 rich towards the middle of the CDS.
Figure 5.
Figure 5.
Distribution of stress-related genes in Citrus species and P. trifoliata according to the GO of Arabidopsis.
Figure 6.
Figure 6.
Hamming distance versus change in GC3 visualization across Citrus species and P. trifoliata. Relative difference GC3 composition between genes A and B, defined as GC3 (A)-GC3 (B)/[GC3 (A) + GC3 (B)] is positively correlated with the Hamming distance between corresponding protein sequences, calculated as 1–[I (AB) + I (BA)]/[I (AA) + I (BB)], where I (AB) is the number of identities in alignment of protein A to protein B. The resulting Hamming distance was rounded to 1 DP, and an average difference in GC3 was computed for each category.

References

    1. Serres-Giardi L., Belkhir K., David J., Glémin S. Patterns and evolution of nucleotide landscapes in seed plants. Plant Cell. 2012;24:1379–97. - PMC - PubMed
    1. Hershberg R., Petrov D.A. General rules for optimal codon choice. PLoS Genet. 2009;5:e1000556. - PMC - PubMed
    1. Grantham R., Gautier C., Gouy M., Jacobzone M., Mercier R. Codon catalog usage is a genome strategy modulated for gene expressivity. Nucleic Acids Res. 1981;9:43–74. - PMC - PubMed
    1. Akashi H. Gene expression and molecular evolution. Curr. Opin. Genet. Dev. 2001;11:660–6. - PubMed
    1. Aragonès L., Guix S., Ribes E., Bosch A., Pintó R.M. Fine-tuning translation kinetics selection as the driving force of codon usage bias in the hepatitis A virus capsid. PLoS Pathol. 2010;6:e1000797. - PMC - PubMed

Publication types