

Presence and persistence of Coxiella burnetii in the environments of goat farms associated with a Q fever outbreak
- PMID: 23315737
- PMCID: PMC3591968
- DOI: 10.1128/AEM.03472-12
Presence and persistence of Coxiella burnetii in the environments of goat farms associated with a Q fever outbreak
Abstract
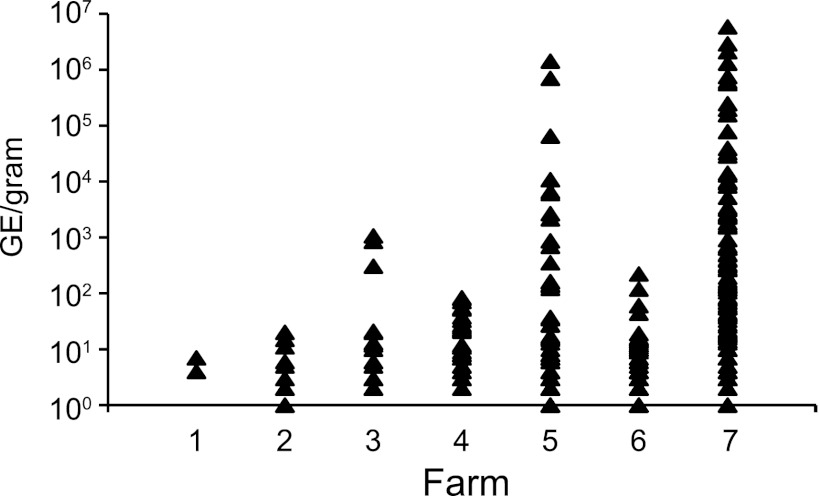
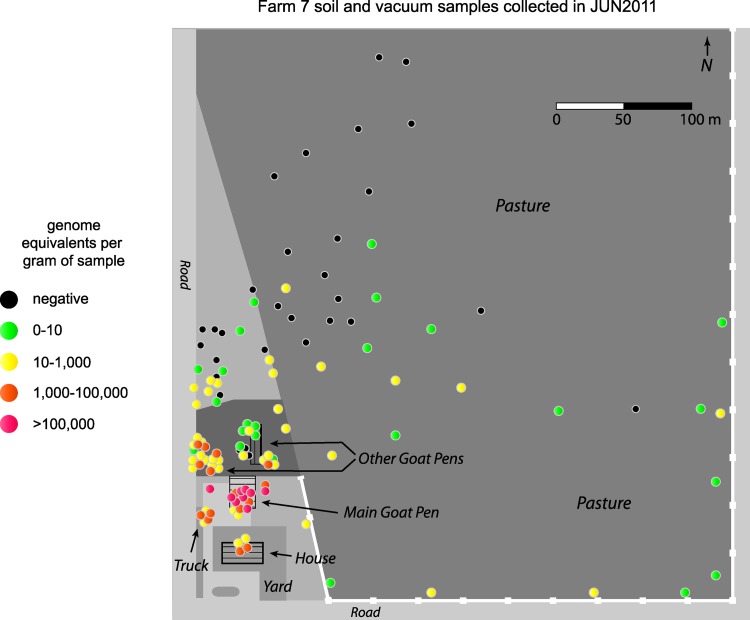
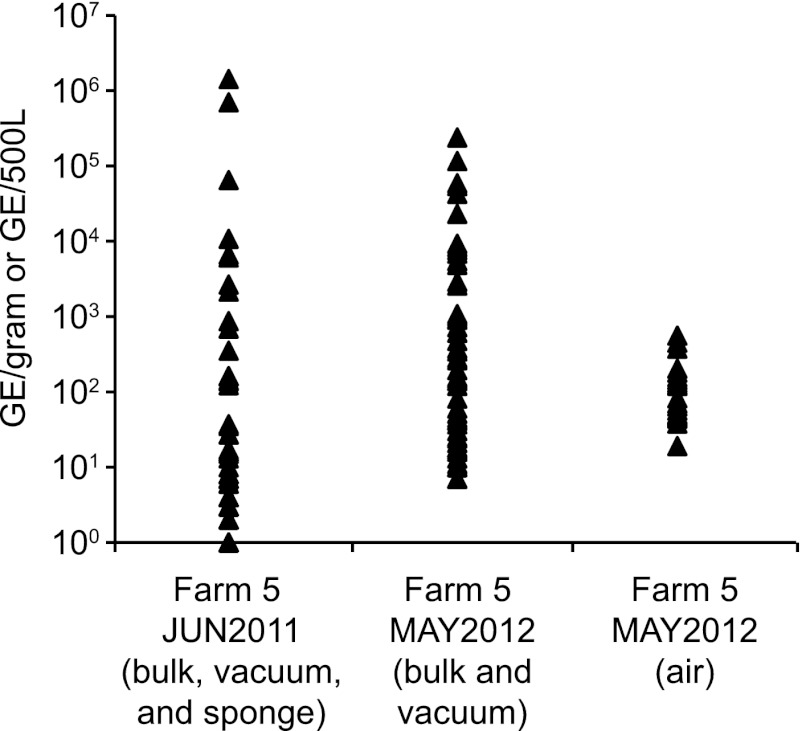
Q fever is a zoonotic disease caused by inhalation of the bacterium Coxiella burnetii. Ruminant livestock are common reservoirs for C. burnetii, and bacteria present in aerosols derived from the waste of infected animals can infect humans. The significance of infection from material deposited in the environment versus transmission directly from infected animals is not known. In 2011, an outbreak of Q fever cases on farms in Washington and Montana was associated with infected goats. A study was undertaken to investigate the quantity and spatial distribution of C. burnetii in the environment of these goat farms. Soil, vacuum, and sponge samples collected on seven farms epidemiologically linked to the outbreak were tested for the presence of C. burnetii DNA by quantitative PCR. Overall, 70.1% of the samples were positive for C. burnetii. All farms had positive samples, but the quantity of C. burnetii varied widely between samples and between farms. High quantities of C. burnetii DNA were in goat housing/birthing areas, and only small quantities were found in samples collected more than 50 m from these areas. Follow-up sampling at one of the farms 1 year after the outbreak found small quantities of C. burnetii DNA in air samples and large quantities of C. burnetii persisting in soil and vacuum samples. The results suggest that the highest concentrations of environmental C. burnetii are found in goat birthing areas and that contamination of other areas is mostly associated with human movement.
Figures
References
-
- Hartzell JD, Wood-Morris RN, Martinez LJ, Trotta RF. 2008. Q fever: epidemiology, diagnosis, and treatment. Mayo Clin. Proc. 83:574–579 - PubMed
-
- van der Hoek W, Dijkstra F, Schimmer B, Schneeberger PM, Vellema P, Wijkmans C, ter Schegget R, Hackert V, van Duynhoven Y. 2010. Q fever in the Netherlands: an update on the epidemiology and control measures. Euro Surveill. 15(12):pii=19520. http://www.eurosurveillance.org/ViewArticle.aspx?ArticleId=19520 - PubMed
-
- Anderson AD, Kruszon-Moran D, Loftis AD, McQuillan G, Nicholson WL, Priestley RA, Candee AJ, Patterson NE, Massung RF. 2009. Seroprevalence of Q fever in the United States, 2003-2004. Am. J. Trop. Med. Hyg. 81:691–694 - PubMed
-
- McQuiston JH, Childs JE. 2002. Q fever in humans and animals in the United States. Vector Borne Zoonotic Dis. 2:179–191 - PubMed
MeSH terms
Substances
LinkOut - more resources
Full Text Sources
Other Literature Sources
