. 2013 Mar;22(3):327-46.
doi: 10.1002/pro.2214. Epub 2013 Jan 27.

Protein lysine-Nζ alkylation and O-phosphorylation mediated by DTT-generated reactive oxygen species

Affiliations

Protein lysine-Nζ alkylation and O-phosphorylation mediated by DTT-generated reactive oxygen species

Nigam Kumar et al. Protein Sci. 2013 Mar.

Abstract

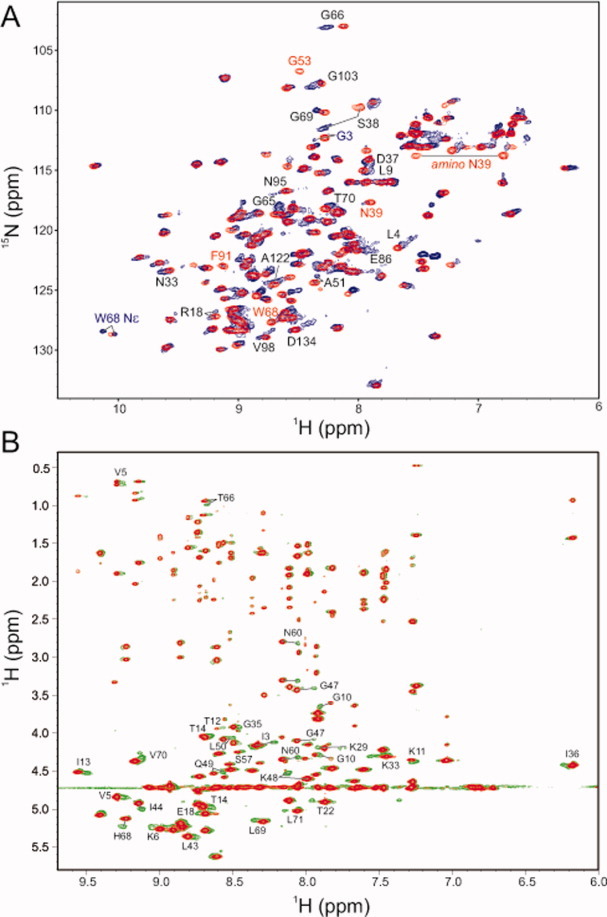
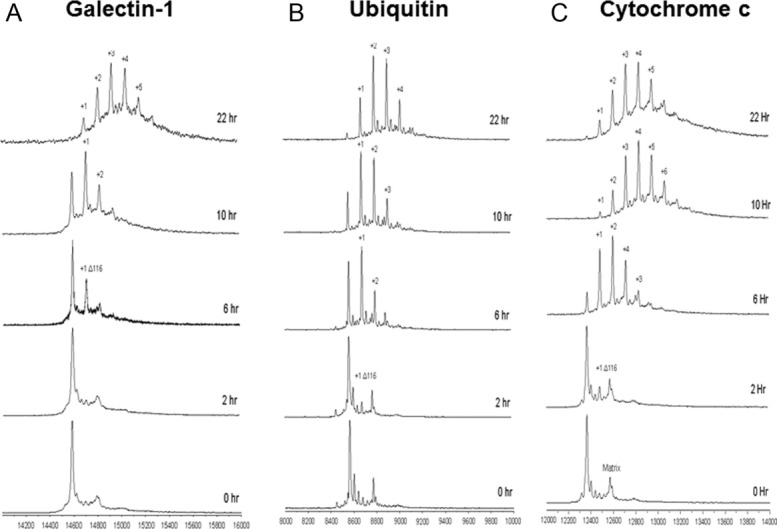
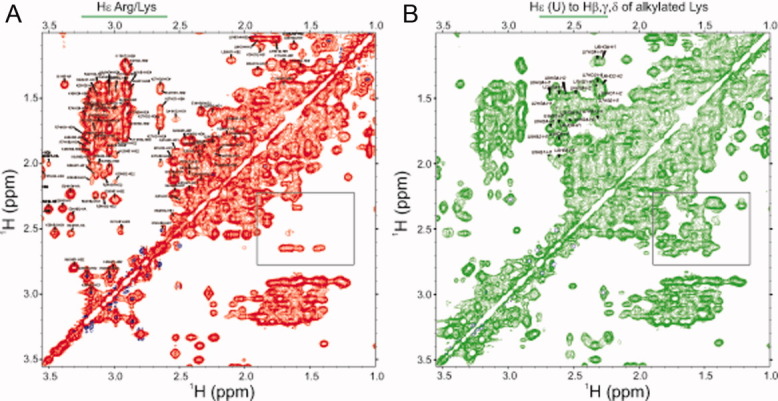
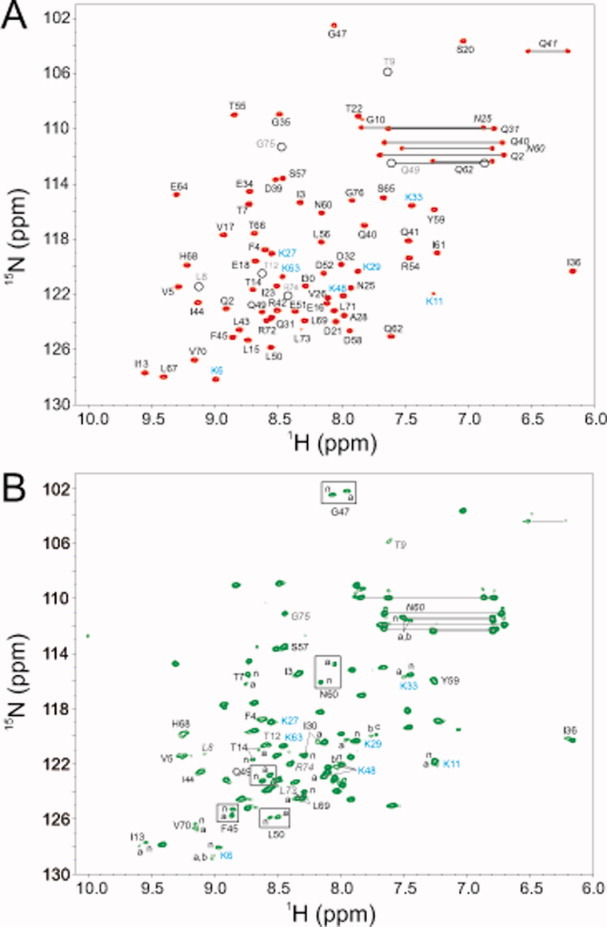
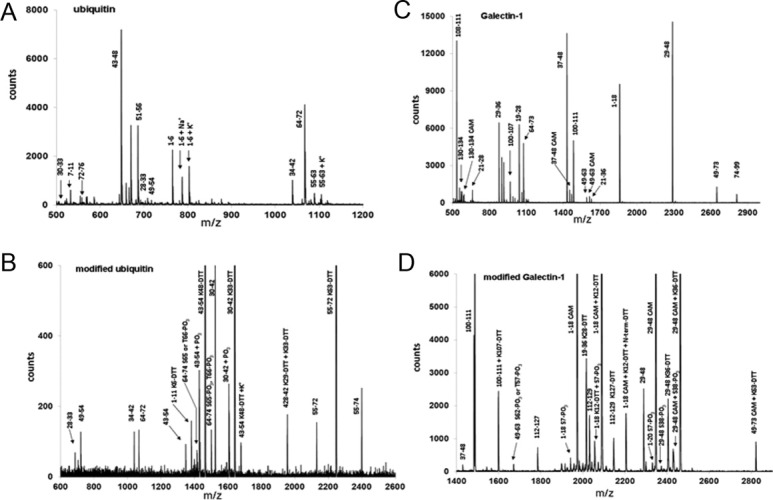
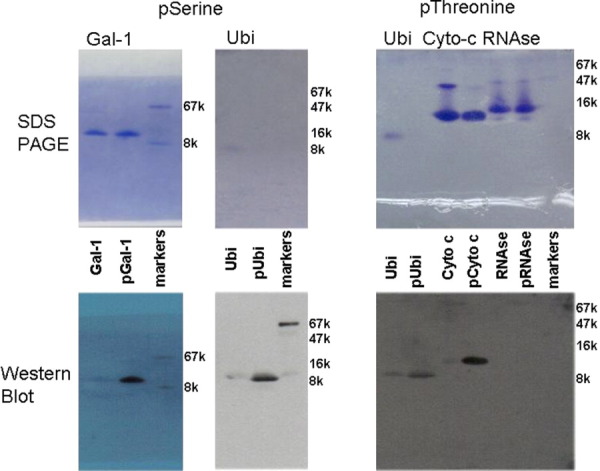
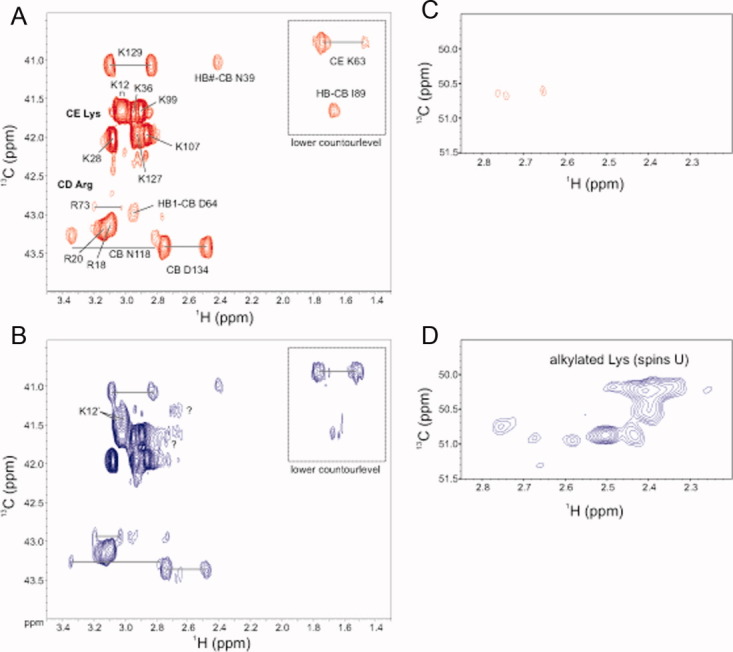
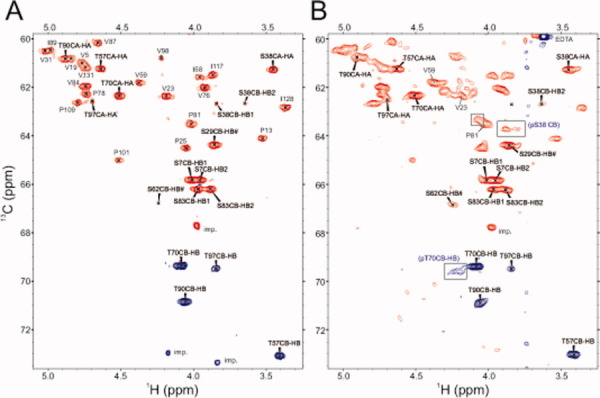
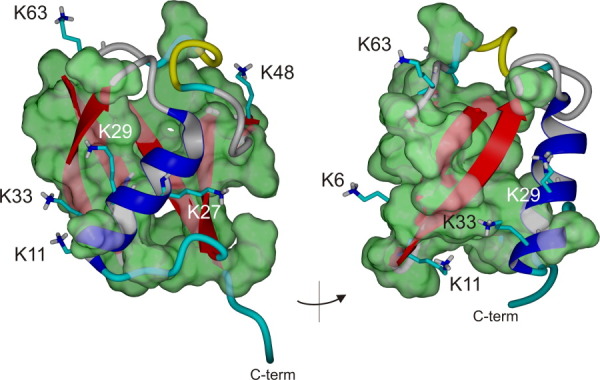
Reactive oxygen species (ROS) play crucial roles in physiology and pathology. In this report, we use NMR spectroscopy and mass spectrometry (MS) to demonstrate that proteins (galectin-1, ubiquitin, RNase, cytochrome c, myoglobin, and lysozyme) under reducing conditions with dithiothreitol (DTT) become alkylated at lysine-N(ζ) groups and O-phosphorylated at serine and threonine residues. These adduction reactions only occur in the presence of monophosphate, potassium, trace metals Fe/Cu, and oxygen, and are promoted by reactive oxygen species (ROS) generated via DTT oxidation. Superoxide mediates the chemistry, because superoxide dismutase inhibits the reaction, and hydroxyl and phosphoryl radicals are also likely involved. While lysine alkylation accounts for most of the adduction, low levels of phosphorylation are also observed at some serine and threonine residues, as determined by western blotting and MS fingerprinting. The adducted alkyl group is found to be a fragment of DTT that forms a Schiff base at lysine N(ζ) groups. Although its exact chemical structure remains unknown, the DTT fragment includes a SH group and a --CHOH--CH₂-- group. Chemical adduction appears to be promoted in the context of a well-folded protein, because some adducted sites in the proteins studied are considerably more reactive than others and the reaction occurs to a lesser extent with shorter, unfolded peptides and not at all with small organic molecules. A structural signature involving clusters of positively charged and other polar groups appears to facilitate the reaction. Overall, our findings demonstrate a novel reaction for DTT-mediated ROS chemistry with proteins.


Figures

Figure 1
Figure 1
NMR data on modified and unmodified Gal-1 and ubiquitin. (A) 15N-1H HSQC spectra (overlaid) of 0.4 mM15N-labeled Gal-1 acquired before (red cross peaks) and after (blue cross peaks) overnight incubation at low protein concentration (10 μM) in 20 mM potassium phosphate, pH 7.3, with 8 mM dithiothreitol (DTT) at 37°C, followed by buffer exchange with standard buffer and concentrating the sample back up to a protein concentration of 0.4 mM. Many cross-peaks in modified Gal-1 vis-à-vis the unmodified protein are shifted and/or appear as multiple peaks and are labeled as such. S38 is one of the phosphorylated residues. (B) 1H DIPSI spectrum (60 ms mixing time) of modified ubiquitin (green cross peaks) overlaid with that of 4 mM unmodified ubiquitin (red cross peaks). [Color figure can be viewed in the online issue, which is available at wileyonlinelibrary.com.]
Figure 2
Figure 2
MALDI-TOF MS data on modified proteins. MS data have been acquired on Gal-1 (A), ubiquitin (B), and cytochrome c (C) as a function of incubation time in 20 mM potassium phosphate, pH 7.3, with 8 mM dithiothreitol (DTT) at 30°C. Time points are shown for 0, 2, 6, 10, and 22 h and are indicated at the right of each MS trace. Unmodified protein is the left most m/z peak in each series. m/z peaks are labeled with +1 to +6 to indicate the number of Δmass 116 groups adducted on each protein on average over time. Smaller m/z peaks result are attributable to the protein plus adhering salts and/or the cinnamic acid matrix used in acquiring MALDI-TOF MS data, as well as phosphorylation as discussed in the text.
Figure 3
Figure 3
1H TOCSY spectra are shown for the unmodified (A) and modified (B) ubiquitin, as discussed in the text. A number of resonances have been labeled, particularly those of lysine and arginine sidechains. The square box in spectrum B displays the region of new resonances that belong to spin systems U that are equivalent to Lys Hε resonances in modified ubiquitin, and are scalar coupled to Hβ, Hγ and Hδ resonances. [Color figure can be viewed in the online issue, which is available at wileyonlinelibrary.com.]
Figure 4
Figure 4
Natural abundance 15N-1H HSQC spectra are shown for unmodified (A) and modified (B) ubiquitin (4 mM protein, 20 mM phosphate, pH 7.3 and 32°C). Some resonances are labeled as discussed in the text, and cross peaks associated with residues around K48 are boxed in. Amide peaks labeled “n” indicate native peaks, whereas peaks labeled “a”, “b,” “c” indicate additional peaks that arise from alkylation of multiple primary amines of lysine and/or the N-terminal amino group. Circles indicate positions of amide resonances that are not observed at the contour level chosen or are otherwise absent from the spectrum due to for example, increased exchange rates with the solvent. [Color figure can be viewed in the online issue, which is available at wileyonlinelibrary.com.]
Figure 5
Figure 5
MS fingerprinting. MALDI-TOF MS fingerprinting data are shown for trypsin-digests of unmodified and modified ubiquitin (A and B) and Gal-1 (C and D). m/z peaks have been labeled with amino acid sequence numbers for each protein, and peptides having additional mass due to chemical modifications are also labeled with the suffix -DTT for alkylation with a fragment of DTT, or -PO3 for phosphorylation, along with the modified residue. The y-axis shows counts. For unmodified ubiquitin (A) and Gal-1 (C), all counts are shown. For modified ubiquitin (B) and Gal-1 (D), counts are shown to emphasize lower intensity m/z peaks. For modified ubiquitin (B), counts are shown up to 10% intensity, and for modified Gal-1 (D), counts are shown up to 80% intensity.
Figure 6
Figure 6
SDS PAGE gels and western blots are shown for modified proteins. The top row shows results from SDS PAGE gels, and the bottom row shows corresponding western blots probed using antibodies against either pSerine (pSer) or pThreonine (pThr), as labeled. Because these results are a composite taken from several experiments, molecular weight markers indicated (bovine serum albumin ∼67 kDa, ovalbumin ∼47 kDa, carbonic anhydrase ∼32 kDa, lysozyme 16 kDa, ubiquntin ∼8 kDa) varying in their position, which depends on conditions under which the gels were run, for example, time and electric field gradient strength. Some bands in PAGE gels are not apparent, most likely due to efficient transfer onto the nitrocellulose membrane used for western blotting. Data are shown for Gal-1 and ubiquitin (Ubi), along with those for cytochrome c (Cyto-c) and RNAse. Lanes are marked for proteins that have not been incubated in the DTT reaction solution, as well as those that have (labeled pGal-1, pUbi, pCyto c, and pRNAse). [Color figure can be viewed in the online issue, which is available at wileyonlinelibrary.com.]
Figure 7
Figure 7
The lysine and arginine side chain region from 13C constant time HSQC spectra of unmodified (A and C) (0.2 mM protein in D2O, 25 mM KPi (pH* 7.5), 8 mM DTT, 0.2 mM EDTA, 32.5°C) and modified (B and D) 13C-labeled Gal-1 (final 0.062 mM protein concentration in same D2O buffer at 32.5°C, after incubation 10 μM protein for 23 h in 20 mM KPi (pH 7.5), 8 mM DTT, 1 mM MgCl2 at 37°C) are shown. Various resonances including spins U from alkylated CE lysines are labeled as discussed in the text. Correlations to proton spins Z and X are not observed under these low protein concentration conditions, because carbons in the covalently attached DTT adduct are not 13C-labeled. [Color figure can be viewed in the online issue, which is available at wileyonlinelibrary.com.]
Figure 8
Figure 8
13C constant-time HSQC spectra (same solution conditions as in Fig. 8) of unmodified (A) and modified (B) 13C-labeled Gal-1 are shown to highlight chemical shift changes of S38 CβH2 (boxed in) and CαH resonances, as well as possibly T70 (boxed in), and surrounding residues, as discussed in the text. Peaks labeled “imp.' indicate non-13C-labeled, low molecular weight impurities. [Color figure can be viewed in the online issue, which is available at wileyonlinelibrary.com.]
Figure 9
Figure 9
Spectral expansions of natural abundance 13C-1H HSQC data on more extensively modified ubiquitin, followed by ultracentrifugation over 3 kDa ultracentrifugation filters and buffer exchange into D2O buffer, are shown here to better visualize resonance dispersion for spins X, U, and Z, as discussed in the text (see also the Supporting Information Fig. S1). Cross peaks have been labeled with numbers following these letter designations to indicate spin- or dipolar coupled grouped resonances, for example, X1 and Z1 are spin coupled in the DTT fragment and dipolar coupled to lysine CεH2 resonance U1, as discussed in the text. [Color figure can be viewed in the online issue, which is available at wileyonlinelibrary.com.]
Figure 10
Figure 10
(A) MALDI-TOF MS data have been acquired on ubiquitin (10 μM) as a function of time, and the fraction of unmodified ubiquitin, and mono-, di-, tri-, and tetra-adducts, were derived and plotted as a function of the ratio of oxidized:reduced DTT. The greatest level of adduction is observed when the ratio of oxidized:reduced DTT is about 4:6. (B) Using data in panel A, initial rates of production of mono-, di- and tri-adducted species were estimated and plotted versus % oxidized DTT. (C) 1H NMR data were used to following the oxidation of DTT versus time. The fraction of oxidized DTT, calculated by integrating resonances for reduced and oxidized DTT, is plotted versus reaction time in the absence and presence of 10 μM ubiquitin. [Color figure can be viewed in the online issue, which is available at wileyonlinelibrary.com.]
Figure 11
Figure 11
The fraction of mono-adduct derived from MALDI-TOF MS data is plotted versus time of incubation for all mono-lysine ubiquitin mutants, along with peptide SC8. The apparent rate of adduction for each protein/peptide was determined simply by taking the linear slope of these plots.
Figure 12
Figure 12
X-ray crystal structure of Gal-1 (PDB access code 1gzw) in (A) with the dimer oriented in a front view, and (B) with the dimer seen from the top. Lysine residues and the N-terminal amino group of A1 are highlighted and labeled in both protein monomers. Green surface coloring display perturbed backbone amides in modified Gal-1. The blue arrows indicate the binding position of the natural ligand lactose that has removed from the view. Cysteine residues are colored yellow. [Color figure can be viewed in the online issue, which is available at wileyonlinelibrary.com.]
Figure 13
Figure 13
X-ray crystal structures ubiquitin (PDB access code 1ubq). Lysine residues are highlighted and labeled. Perturbed backbone and side chain atoms of nonlysine residues in the modified ubiquitin are shown by green surface coloring. [Color figure can be viewed in the online issue, which is available at wileyonlinelibrary.com.]

Similar articles

Cited by

References

    1. Misra HP. Generation of superoxide free radical during the autoxidation of thiols. J Biol Chem. 1974;249:2151–2155. - PubMed
    1. Kachur AV, Held KD, Koch CJ, Biaglow JE. Mechanism of production of hydroxyl radicals in the copper-catalyzed oxidation of dithiothreitol. Radiat Res. 1997;147:409–415. - PubMed
    1. Han D, Williams E, Cadenas E. Mitochondrial respiratory chain-dependent generation of superoxide anion and its release into the intermembrane space. Biochem J. 2001;353:411–416. - PMC - PubMed
    1. Dickinson BC, Chang CJ. Chemistry and biology of reactive oxygen species in signaling or stress responses. Nat Chem Biol. 2011;7:504–511. - PMC - PubMed
    1. Devasagayam TP, Tilak JC, Boloor KK, Sane KS, Ghaskadbi SS, Lele RD. Free radicals and antioxidants in human health: current status and future prospects. J Assoc Phys India. 2004;52:794–804. - PubMed

Publication types

LinkOut - more resources