. 2013 Jan:Chapter 2:Unit 2.18.
doi: 10.1002/0471142301.ns0218s62.

Tracking quantum dot-tagged calcium channels at vertebrate photoreceptor synapses: retinal slices and dissociated cells

Affiliations

Tracking quantum dot-tagged calcium channels at vertebrate photoreceptor synapses: retinal slices and dissociated cells

Aaron J Mercer et al. Curr Protoc Neurosci. 2013 Jan.

Abstract

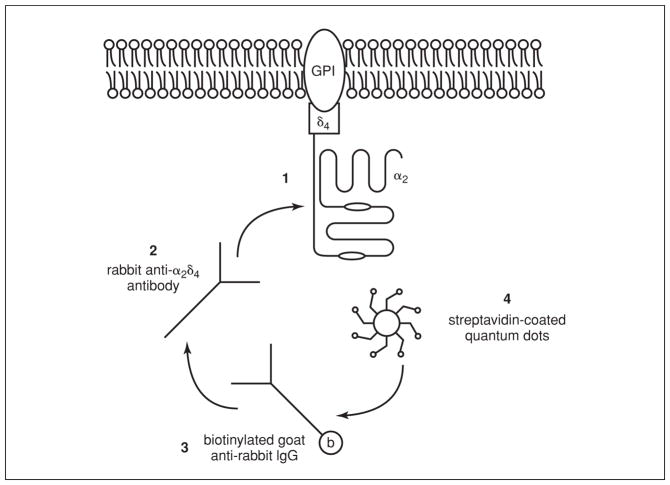
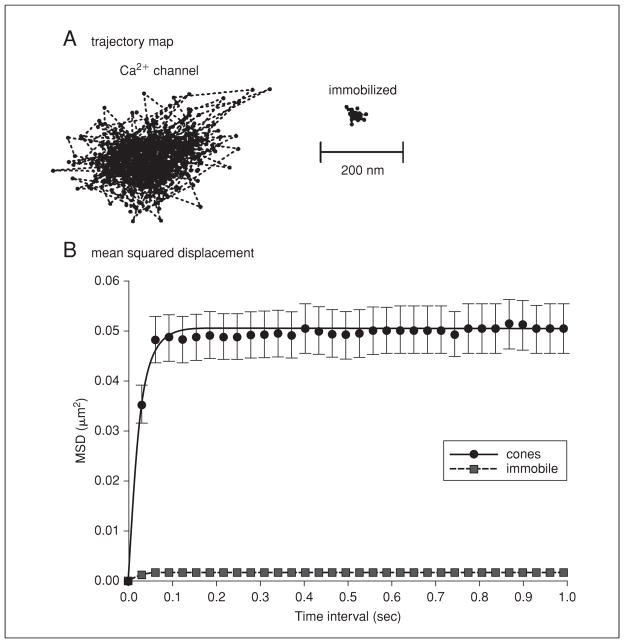
At synapses in the central nervous system, precisely localized assemblies of presynaptic proteins, neurotransmitter-filled vesicles, and postsynaptic receptors are required to communicate messages between neurons. Our understanding of synaptic function has been significantly advanced using electrophysiological methods, but the dynamic spatial behavior and real-time organization of synapses remains poorly understood. In this unit, we describe a method for labeling individual presynaptic calcium channels with photostable quantum dots for single-particle tracking analysis. We have used this technique to examine the mobility of L-type calcium channels in the presynaptic membrane of rod and cone photoreceptors in the retina. These channels control release of glutamate-filled synaptic vesicles at the ribbon synapses in photoreceptor terminals. This technique offers the advantage of providing a real-time biophysical readout of ion channel mobility and can be manipulated by pharmacological or electrophysiological methods. For example, the combination of electrophysiological and single-particle tracking experiments has revealed that fusion of nearby vesicles influences calcium channel mobility and changes in channel mobility can influence release. These approaches can also be readily adapted to examine membrane proteins in other systems.


Figures

Figure 2.18.1
Figure 2.18.1
Binding strategy to attach QDs to extracellular α2δ4 CaV channel subunits. QDs are attached to the extracellular α2 arm of CaV α2δ4 subunits (1) by first attaching a rabbit anti-human α2δ4 antibody for 3 hr at 4°C (2) to recognize the epitope Ac-KVSDRKFLTPEDEASVC-amide (Qin et al., 2002). Slices are next incubated for 1 hr at 4°C with a goat anti-rabbit biotinylated antibody (3). The biotin domain on the secondary antibody forms a strong covalent bond with streptavidin-coated QDs (4), which are attached by incubation for 15 min at room temperature. Note that In this schematic we represent the α2δ4 subunit as a glycophosphotidylinositol (GPI)–anchored protein. Although studies have yet to resolve the full structure of CaV1.4 channel-associated α2δ4 subunits, other α2δ subunits that associate with L-type CaV channels are GPI-anchored proteins (Bauer et al., 2010; Davies et al., 2010). We speculate that α2δ4 subunits may have a similar structure and orientation at photoreceptor synapses.
Figure 2.18.2
Figure 2.18.2
Images of photoreceptors labeled with QDs. (A) QD attached to the α2δ4 subunit of a cone in the outer plexiform layer (OPL) of an amphibian retinal slice (arrow). The photoreceptor (PR) layer, OPL, inner nuclear layer (INL), and inner plexiform layer (IPL) are labeled in the figure. A higher-powered magnification of the QD is shown in the inset. Retinal slices were prepared as described in Basic Protocol 1. (B) A single QD attached to a CaV channel in the synaptic terminal of an isolated rod (arrow). The terminal, soma and inner segment regions are labeled. Cells were enzymatically dissociated as described in Support Protocol 2. In both images, one can see nonspecific autofluorescence in the inner segments due to flavoproteins in the mitochondrial-rich ellipsoid region (Kunz and Kunz, 1985). QDs were attached to extracellular CaV channel α2δ4 subunits using the techniques described in Basic Protocol 2. Anatomical location, intermittent blinking, and a small size <8 pixels were used to identify QDs for tracking analysis. For this figure, QD fluorescence was averaged from 400 frames acquired at 50-msec intervals in A and 30-msec intervals in B. Bright-field images were acquired using a 100-msec acquisition period. Fluorescent images were pseudo-colored green and overlaid onto bright-field images using ImageJ. Scale bar = 10 μm.
Figure 2.18.3
Figure 2.18.3
QD trajectory plot and MSD analysis. (A) Representative trajectory map of a QD attached to a CaV channel on the terminal of an isolated cone photoreceptor. Individual trajectory points show the coordinates of a single QD every 30 msec during a 12-sec acquisition period. Immobilized QDs, such as that shown at the right, exhibit trajectory maps that are a fraction of those exhibited by QDs moving at photoreceptor synapses. QD-attached CaV channels at the synapses of isolated cone photoreceptors were imaged following Basic Protocol 3. Photoreceptors were imaged using an Olympus IX71 inverted microscope and a 1.45-NA oil-immersion objective. (B) Raw x and y data from QD SPT experiments were analyzed using the equations described in step 9a of Basic Protocol 3. Mean squared displacement (MSD) data are plotted as a function of the measurement time interval. QD-labeled CaV channels (black circles) show a significantly greater increase in MSD than immobilized QDs (squares). The MSD of cone CaV channels quickly reached a plateau, indicating that these proteins are confined within a limited domain. To calculate the size of the confinement domain, we fit the data with the equation in step 9c of Basic Protocol 3. In this sample, we found that cone CaV channels were confined to a surface area of 0.15 μm2, consistent with previous observations in retinal slice and dissociated retina preparations (Mercer et al., 2011a; Mercer et al., 2012).

Similar articles

Cited by

References

    1. Alcor D, Gouzer G, Triller A. Single-particle tracking methods for the study of membrane receptors dynamics. Eur J Neurosci. 2009;30:987–997. - PubMed
    1. Babai N, Thoreson WB. Horizontal cell feedback regulates calcium currents and intracellular calcium levels in rod photoreceptors of salamander and mouse retina. J Physiol. 2009;587:2353–2364. - PMC - PubMed
    1. Babai N, Morgans CW, Thoreson WB. Calcium-induced calcium release contributes to synaptic release from mouse rod photoreceptors. Neuroscience. 2010;165:1447–1456. - PMC - PubMed
    1. Bannai H, Levi S, Schweizer C, Dahan M, Triller A. Imaging the lateral diffusion of membrane molecules with quantum dots. Nat Protoc. 2006;1:2628–2634. - PubMed
    1. Bannai H, Levi S, Schweizer C, Inoue T, Launey T, Racine V, Sibarita JB, Mikoshiba K, Triller A. Activity-dependent tuning of inhibitory neurotransmission based on GABAAR diffusion dynamics. Neuron. 2009;62:670–682. - PubMed

Publication types

MeSH terms

LinkOut - more resources