. 2013 Feb 1;117(2):145-157.
doi: 10.1016/j.cviu.2012.10.006.

A Multiple Object Geometric Deformable Model for Image Segmentation

Affiliations

A Multiple Object Geometric Deformable Model for Image Segmentation

John A Bogovic et al. Comput Vis Image Underst. .

Abstract

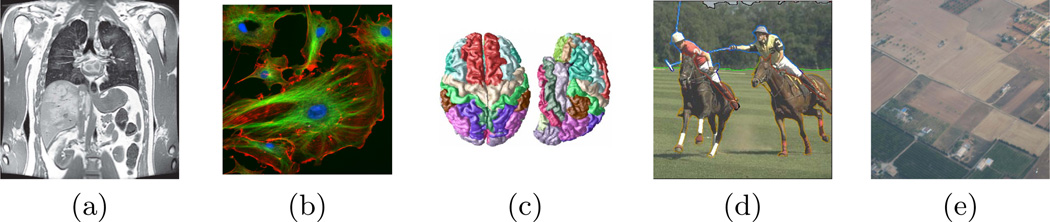
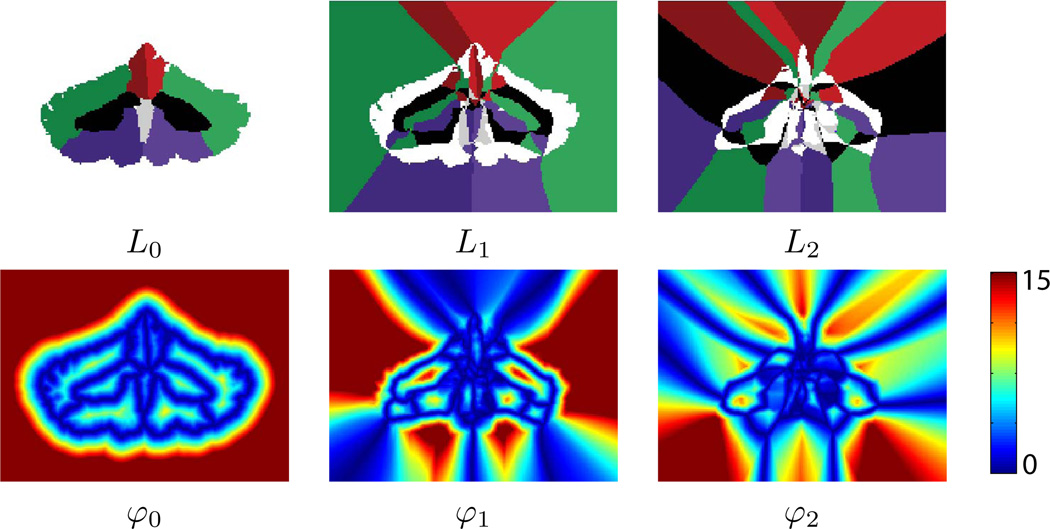
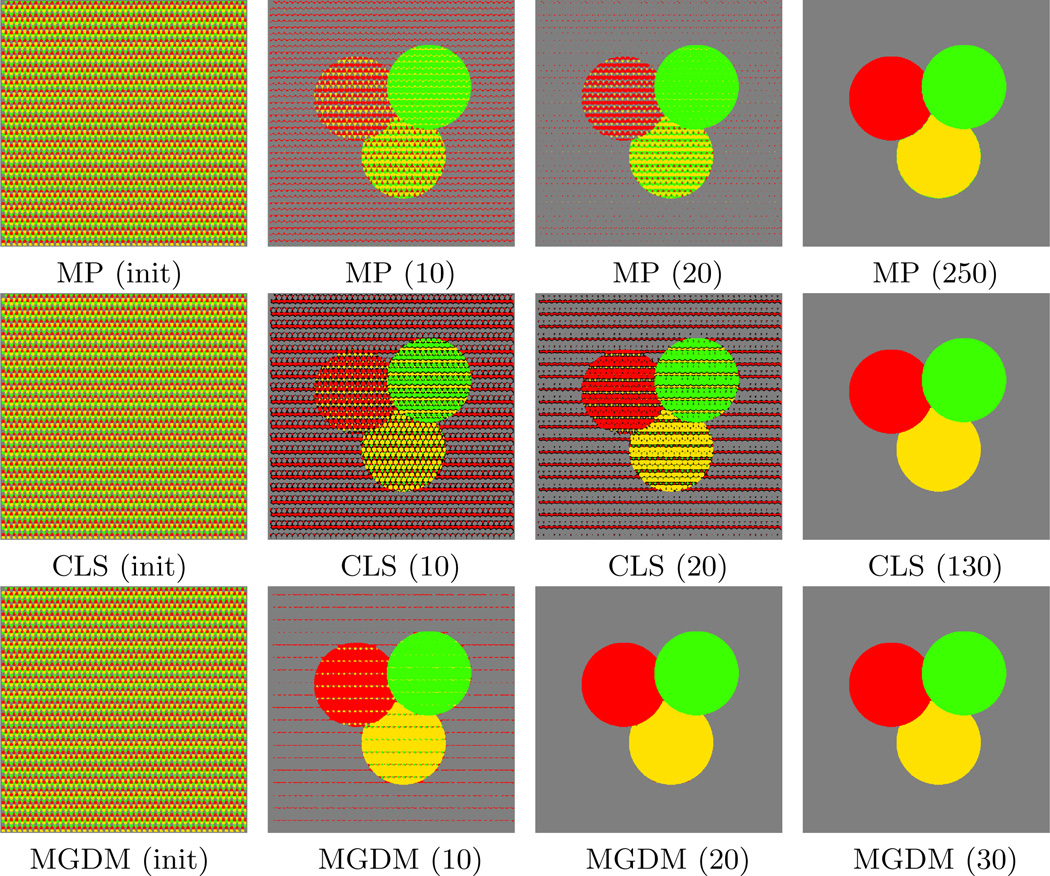
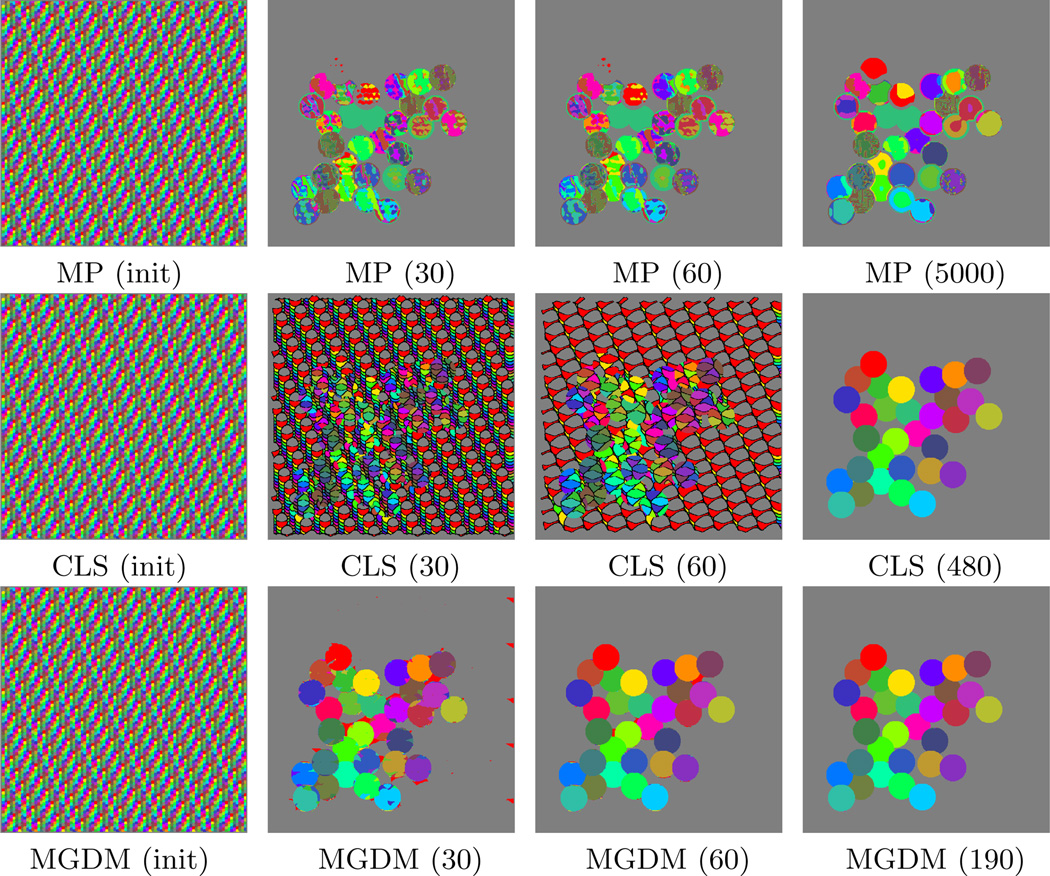
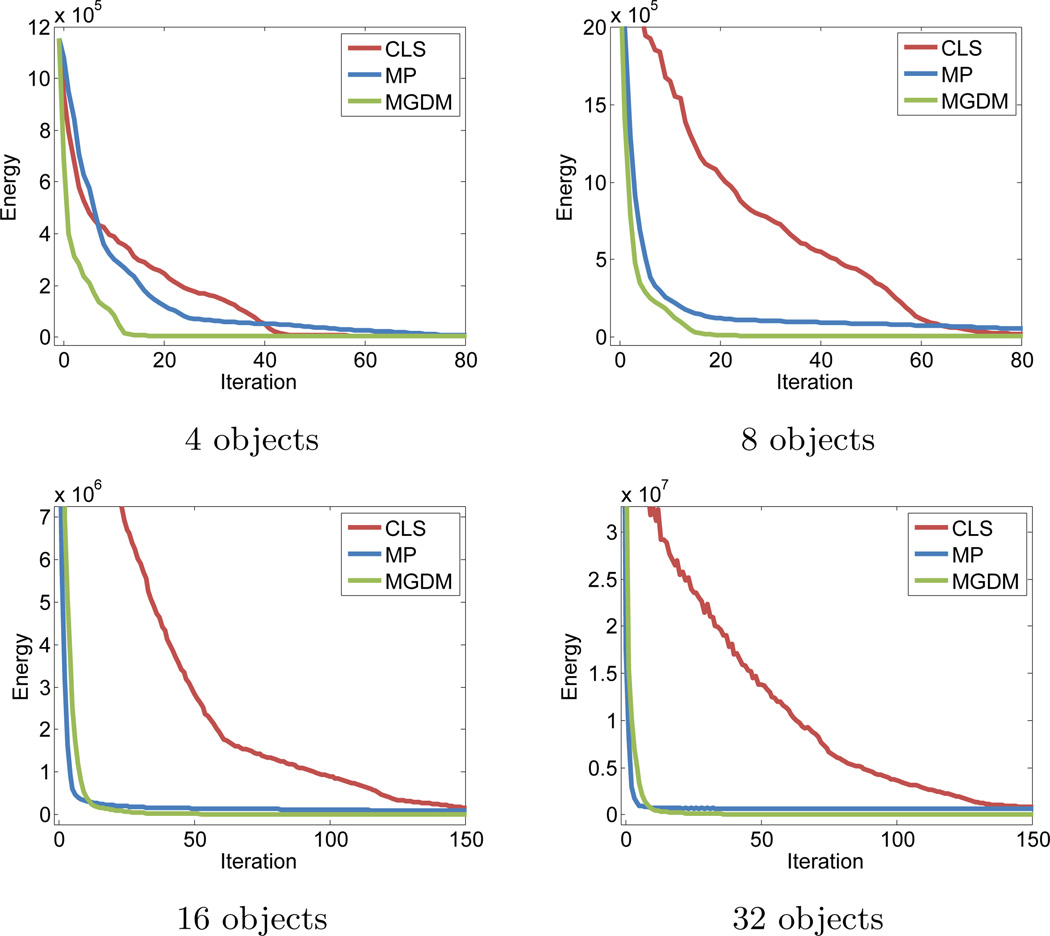
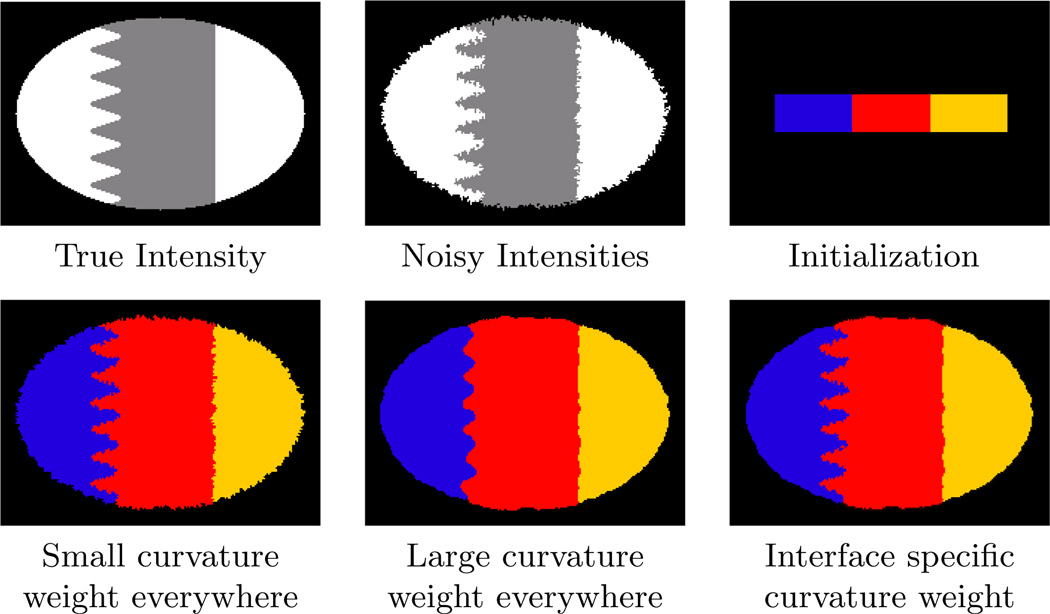
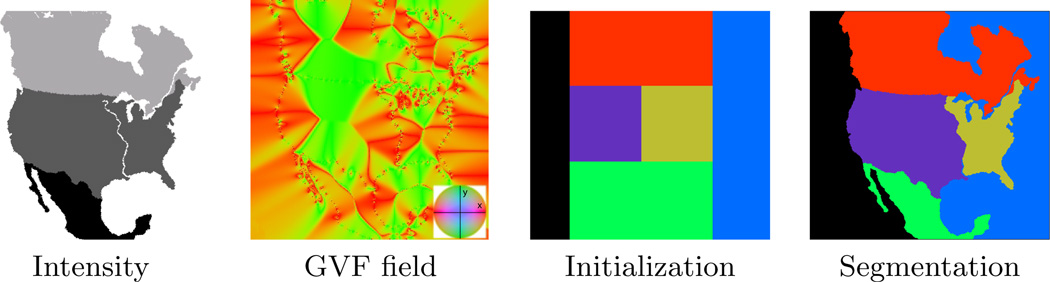
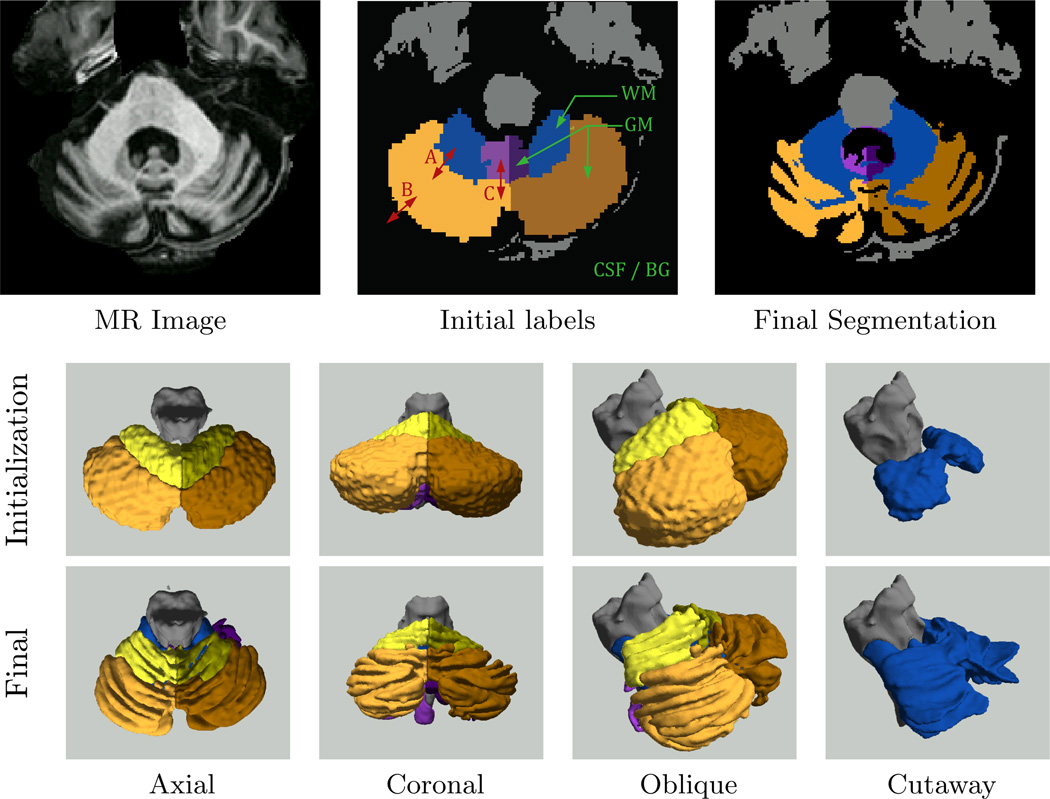
Deformable models are widely used for image segmentation, most commonly to find single objects within an image. Although several methods have been proposed to segment multiple objects using deformable models, substantial limitations in their utility remain. This paper presents a multiple object segmentation method using a novel and efficient object representation for both two and three dimensions. The new framework guarantees object relationships and topology, prevents overlaps and gaps, enables boundary-specific speeds, and has a computationally efficient evolution scheme that is largely independent of the number of objects. Maintaining object relationships and straightforward use of object-specific and boundary-specific smoothing and advection forces enables the segmentation of objects with multiple compartments, a critical capability in the parcellation of organs in medical imaging. Comparing the new framework with previous approaches shows its superior performance and scalability.


Figures

Figure 1
Figure 1
Various problems where images are to be segmented into multiple interacting objects: a) an MRI of the abdomen, showing many organs; b) fluorescent microscopy imaging involving complex interactions of multiple cells; c) a parcellation of the cortex into 78 gyral regions; c) images and videos of sporting events where the different players interact; d) aerial images of crops and farmlands. These examples were obtained from computer vision and medical imaging databases [3, 26, 27] or our own work (c) [28].
Figure 2
Figure 2
Illustration of a three-level label-distance decomposition of a parcellated cerebellum: The color used for each object’s label is identical for L0, L1, and L2. The color scale for the distance functions have been compressed to the range [0, 15] to focus contrast around the boundaries. Here, blue pixels indicate points very close to a boundary, yellow pixels are more distant, and red are most distant.
Figure 3
Figure 3
Comparative experiments with four objects. The value in parenthesis indicates the iteration being shown. The rightmost column shows each algorithm’s result at convergence.
Figure 4
Figure 4
Comparative experiments with 32 objects. The value in parenthesis indicates the iteration being shown. The rightmost column shows each algorithm’s result at convergence.
Figure 5
Figure 5
Evolution of the global energy function E for different numbers of objects.
Figure 6
Figure 6
A simple example demonstrating the benefits of applying different speeds on different boundaries. In this case, an intensity weight of 0.7 was applied in all cases. Curvature terms with weights of 0.1 and 1.0 were applied to all objects in the “Small curvature” and “Large curvature” cases. In the variable curvature experiment, a curvature weight of 0.1 was applied to the red-blue boundary, while all other boundaries had a curvature weight of 1.0. This allowed the high spatial frequencies of the true object to be captured on one boundary, while simultaneously and correctly smoothing noise on another.
Figure 7
Figure 7
A synthesized example showing the usage of different types of speeds (intensity and advection field). The x and y components of the GVF field are rendered in red and green, respectively. The eastern and western US are delineated by the GVF field despite having the same image intensity.
Figure 8
Figure 8
Example of cerebellum segmentation results using MGDM. The top row shows 2D slices of the source image, initial labels, and final segmentation. The initial labels are annotated with tissue types (green) and boundary speed types (red). The GM-GM speeds (A), the WM-GM speeds (B), and the (GM-CSF) speeds are summarized in Table 2. The middle and bottom rows show 3D renderings of the initial labels and final segmentation, respectively. The gray matter labels were removed in the cutaway figure so that the white matter (rendered in blue) would be visible.
Figure 9
Figure 9
Illustrations of the decomposition’s limitations assuming a two function approximation in 2D. In (a) the MGDM decomposotion can perfectly represent the distances to 3 different objects (including the current object) at a point, when 2 distance functions are used. The white object is the current label at the centerpoint. When one or two other object (blue and pink) are nearby, the true boundary locations (black lines) to those objects can be represented perfectly with two distance functions. However, when a third (green) or fourth (orange) object is nearby but further than the first two objects, MGDM approximates their distances (gray dotted lines) with the distance to the second neighbor and incurs errors, the magnitudes of which are indicated by the red arrows. The errors can be eliminated by storing additional levels of the decomposition. In (b), the 1D plot of the reconstructed level set function for object O1 (along the dotted line), shows how approximations appear when we are further from the object’s boundaries than from other object’s boundaries.

References

    1. Fischl B, Salat DH, Busa E, Albert M, Dieterich M, Haselgrove C, van der Kouwe A, Killiany R, Kennedy D, Klaveness S, Montillo A, Makris N, Rosen B, Dale AM. Whole brain segmentation: automated labeling of neuroanatomical structures in the human brain. Neuron. 2002;33(3):341–355. - PubMed
    1. Okada T, Shimada R, Sato Y, Hori M, Yokota K, Nakamoto M, Chen Y-W, Nakamura H, Tamura S. Automated segmentation of the liver from 3D CT images using probabilistic atlas and multi-level statistical shape model. Proc. MICCAI. 2007;10:86–93. - PubMed
    1. Spitzer V, Ackerman MJ, Scherzinger AL, Whitlock D. The visible human male: a technical report. JAMIA. 1996;3:118–130. - PMC - PubMed
    1. Heimann T, Münzing S, Meinzer H-P, Wolf I. A shape-guided deformable model with evolutionary algorithm initialization for 3D soft tissue segmentation. Proc. IPMI. 2007:1–12. - PubMed
    1. Lu C, Pizer SM, Joshi S, Jeong J-Y. Statistical Multi-Object Shape Models. International Journal of Computer Vision. 2007;75(3):387–404.