. 2013 Jan 4:6:65.
doi: 10.3389/fncel.2012.00065. eCollection 2012.

Developmental regulation of spatio-temporal patterns of cortical circuit activation

Affiliations

Developmental regulation of spatio-temporal patterns of cortical circuit activation

Trevor C Griffen et al. Front Cell Neurosci. .

Abstract

Neural circuits are refined in an experience-dependent manner during early postnatal development. How development modulates the spatio-temporal propagation of activity through cortical circuits is poorly understood. Here we use voltage-sensitive dye imaging (VSD) to show that there are significant changes in the spatio-temporal patterns of intracortical signals in primary visual cortex (V1) from postnatal day 13 (P13), eye opening, to P28, the peak of the critical period for rodent visual cortical plasticity. Upon direct stimulation of layer 4 (L4), activity spreads to L2/3 and to L5 at all ages. However, while from eye opening to the peak of the critical period, the amplitude and persistence of the voltage signal decrease, peak activation is reached more quickly and the interlaminar gain increases with age. The lateral spread of activation within layers remains unchanged throughout the time window under analysis. These developmental changes in spatio-temporal patterns of intracortical circuit activation are mediated by differences in the contributions of excitatory and inhibitory synaptic components. Our results demonstrate that after eye opening the circuit in V1 is refined through a progression of changes that shape the spatio-temporal patterns of circuit activation. Signals become more efficiently propagated across layers through developmentally regulated changes in interlaminar gain.

Keywords: AMPA; GABA; NMDA; microcircuitry; postnatal development; signal propagation; synaptic plasticity; visual cortex.


Figures
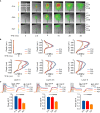
Figure 1
Figure 1
Developmental reduction in cortical activation. (A) Representative sample VSD images at 0, 2.5, 5, 10, 20, and 30 ms from L4 stimulation for each age group. Images were cropped to better visualize the activated region (from 60 × 88 to 45 × 50 pixels, 20 μm per pixel). Top left panel: White boxes: ROIs quantified in panel (C), Figures 2, 3, 5, 6, and 7. Vertical white dashed line: ROI quantified in panel (B). Horizontal white dashed lines: ROIs quantified in Figure 4. (B) Time course of the ΔF/F measured by line scans perpendicular to the pial surface. Blue: P14. Red: P20. Orange: P27. Error bars: ± SEM. (C) Top: Time course of optical signals measured from ROIs in L4, L2/3, and L5 from 10 ms before stimulation to 50 ms after stimulation on the left. The gray box indicates TFS 0 to 15 ms, which is shown amplified in the traces on the right to highlight changes in the time to peak. Blue: P14. Red: P20. Orange: P27. Light gray line: 0.0 ΔF/F. Bottom: Peak ΔF/F measured from ROIs in L4, L2/3, and L5. Blue: P14. Red: P20. Orange: P27. Error bars: ± SEM. Dark bars indicate significant changes, p < 0.05.
Figure 2
Figure 2
Developmental reduction in signal persistence. Top: Time course of optical signals from ROIs in L4, L2/3, and L5 from 10 ms before stimulation to 50 ms after stimulation normalized to the peak ΔF/F measured in each ROI. Blue: P14. Red: P20. Orange: P27. Light gray line: 0.0 ΔF/F. Light gray dash: TFS 30 ms. Bottom: ΔF/F at 30 ms normalized to the peak ΔF/F measured from ROIs in L4, L2/3, and L5. Blue: P14. Red: P20. Orange: P27. Error bars: ± SEM. Dark bars indicate significant changes, p < 0.05.
Figure 3
Figure 3
Developmental increase in interlaminar gain. (A) Time course of optical signals measured from ROIs at P14, P20, and P27 from 10 ms before stimulation to 50 ms after stimulation. Green: L2/3. Black: L4. Gray: L5. Light gray line: 0.0 ΔF/F. The unique color scheme of this panel reflects data organized by cortical layer, whereas in other panels, the color scheme reflects data organized by developmental age group. (B) Gain from L4 to L2/3 and L5 measured as the ratio of the peak ΔF/F from a ROI in L2/3 or L5 to the peak ΔF/F in a ROI in L4. Blue: P14. Red: P20. Orange: P27. Error bars: ± SEM. Dark bars indicate significant changes, p < 0.05.
Figure 4
Figure 4
No developmental change in horizontal spread of VSD signal. (A) ΔF/F measured by line scans through L4 at TFS 5 and 20 ms. Blue: P14. Red: P20. Orange: P27. Error bars: ± SEM. (B) ΔF/F measured by line scans through L2/3 at TFS 5 and 20 ms. Blue: P14. Red: P20. Orange: P27. Error bars: ± SEM. (C) Plot of the width of activation in L4 and L2/3 at different TFS. Blue: P14. Red: P20. Orange: P27. Error bars: ± SEM. (D) Plot of the ratios of the width of activation in L2/3 to L4 at different TFS. Blue: P14. Red: P20. Orange: P27. Error bars: ± SEM.
Figure 5
Figure 5
Developmental decrease in the fast and slow NMDA receptor components of circuit activation. (A) Top: Time course of the NMDA receptor component of the optical signals measured from ROIs in L4, L2/3, and L5 from 10 ms before stimulation to 50 ms after stimulation. The NMDA receptor-mediated component of the signal was obtained by subtracting the VSD signal remaining after perfusion of APV from the one recorded in ACSF. Blue: P14. Red: P20. Orange: P27. Light gray line: 0.0 ΔF/F. Light gray dashes: TFS 0 ms and 20 ms. Bottom: Total ΔF/F of the NMDA receptor component of the optical signal for 20 ms from stimulation measured from ROIs in L4, L2/3, and L5. Blue: P14. Red: P20. Orange: P27. Error bars: ± SEM. Dark bars indicate significant changes, p < 0.05. (B) Top: Time course of the NMDA component of the optical signals from ROIs in L4, L2/3, and L5 from 10 ms before stimulation to 50 ms after stimulation normalized to the peak ΔF/F measured in each ROI before application of synaptic blockers. Blue: P14. Red: P20. Orange: P27. Light gray line: 0.0 ΔF/F. Light gray dash: TFS 30 ms. Bottom: ΔF/F of the NMDA receptor component of the optical signal at 30 ms normalized to the peak ΔF/F before application of synaptic blockers measured from ROIs in L4, L2/3, and L5. Blue: P14. Red: P20. Orange: P27. Error bars: ± SEM. Dark bars indicate significant changes, p < 0.05.
Figure 6
Figure 6
Developmental decrease in the fast AMPA receptor component of circuit activation. (A) Top: Time course of the AMPA receptor component of the optical signals measured from ROIs in L4, L2/3, and L5 from 10 ms before stimulation to 50 ms after stimulation. The AMPA receptor component of the signal was obtained by subtracting the VSD signal remaining after DNQX from the signal measured in ACSF with APV. Blue: P14. Red: P20. Orange: P27. Light gray line: 0.0 ΔF/F. Light gray dashes: TFS 0 ms and 20 ms. Bottom: Total ΔF/F of the AMPA receptor component of the optical signal for 20 ms from stimulation measured from ROIs in L4, L2/3, and L5. Blue: P14. Red: P20. Orange: P27. Error bars: ± SEM. Dark bars indicate significant changes, p < 0.05. (B) Top: Time course of the AMPA component of the optical signals from ROIs in L4, L2/3, and L5 from 10 ms before stimulation to 50 ms after stimulation normalized to the peak ΔF/F measured in each ROI before application of synaptic blockers. Blue: P14. Red: P20. Orange: P27. Light gray line: 0.0 ΔF/F. Light gray dash: TFS 30 ms. Bottom: ΔF/F of the AMPA receptor component of the optical signal at 30 ms normalized to the peak ΔF/F before application of synaptic blockers measured from ROIs in L4, L2/3, and L5. Blue: P14. Red: P20. Orange: P27. Error bars: ± SEM.
Figure 7
Figure 7
Developmental increase in the GABAA receptor component of circuit activation. Top: Time course of the GABAA receptor component of the optical signals measured from ROIs in L4, L2/3, and L5 from 10 ms before stimulation to 50 ms after stimulation. The GABAA receptor-mediated component of the signal was obtained by subtracting the VSD signal remaining after perfusion of picrotoxin from the one recorded in ACSF with APV and DNXQ. Blue: P14. Red: P20. Orange: P27. Light gray line: 0.0 ΔF/F. Light gray dashes: TFS 0 ms and 10 ms. Bottom: Total ΔF/F of the GABAA receptor component of the optical signal for 10 ms from stimulation measured from ROIs in L4, L2/3, and L5. Blue: P14. Red: P20. Orange: P27. Error bars: ± SEM. Dark bars indicate significant changes, p < 0.05.

Similar articles

Cited by

References

    1. Ames A., 3rd. (2000). CNS energy metabolism as related to function. Brain Res. Brain Res. Rev. 34, 42–68 10.1016/S0165-0173(00)00038-2 - DOI - PubMed
    1. Antolík J., Bednar J. A. (2011). Development of maps of simple and complex cells in the primary visual cortex. Front. Comput. Neurosci. 5:17 10.3389/fncom.2011.00017 - DOI - PMC - PubMed
    1. Antonini A., Stryker M. P. (1993). Development of individual geniculocortical arbors in cat striate cortex and effects of binocular impulse blockade. J. Neurosci. 13, 3549–3573 - PMC - PubMed
    1. Barkat T. R., Polley D. B., Hensch T. K. (2011). A critical period for auditory thalamocortical connectivity. Nat. Neurosci. 14, 1189–1194 10.1038/nn.2882 - DOI - PMC - PubMed
    1. Blue M. E., Parnavelas J. G. (1983). The formation and maturation of synapses in the visual cortex of the rat. II. Quantitative analysis. J. Neurocytol. 12, 697–712 - PubMed

LinkOut - more resources