. 2013 Jan 9:6:79.
doi: 10.3389/fnsys.2012.00079. eCollection 2012.

Cell-type-specific modulation of neocortical activity by basal forebrain input

Affiliations

Cell-type-specific modulation of neocortical activity by basal forebrain input

Henry J Alitto et al. Front Syst Neurosci. .

Abstract

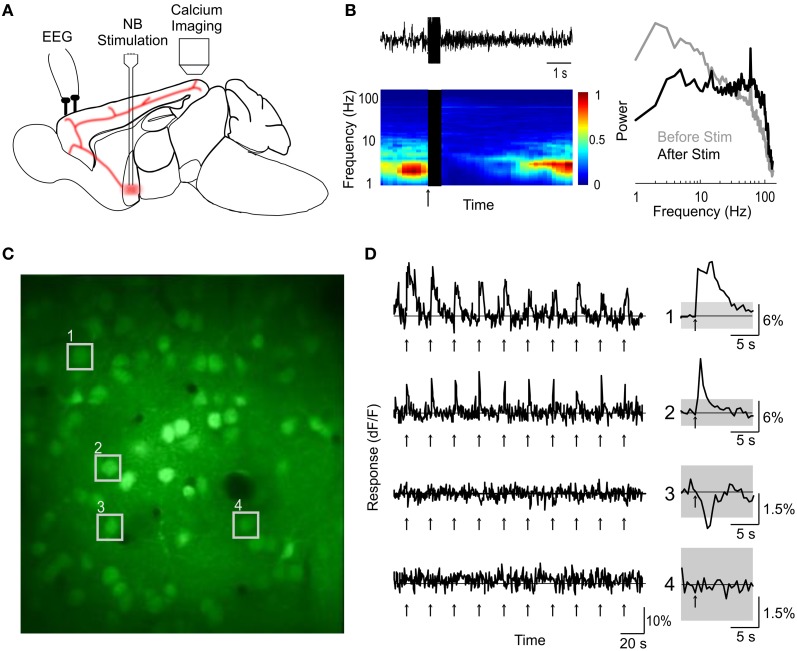
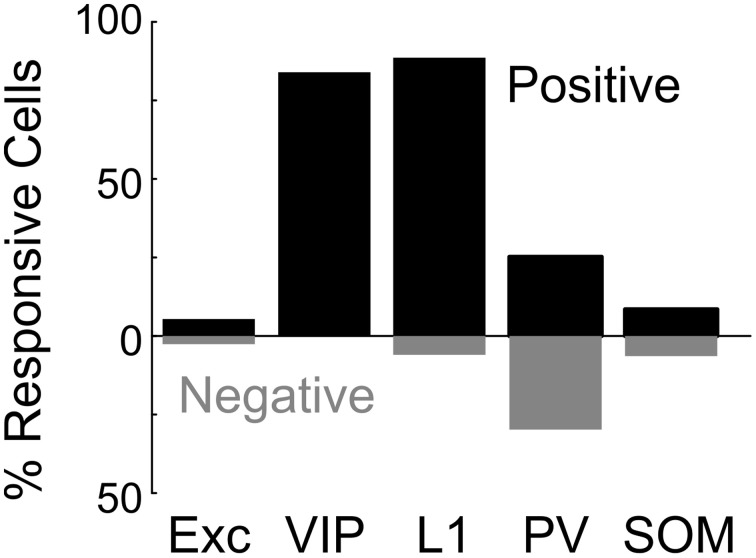
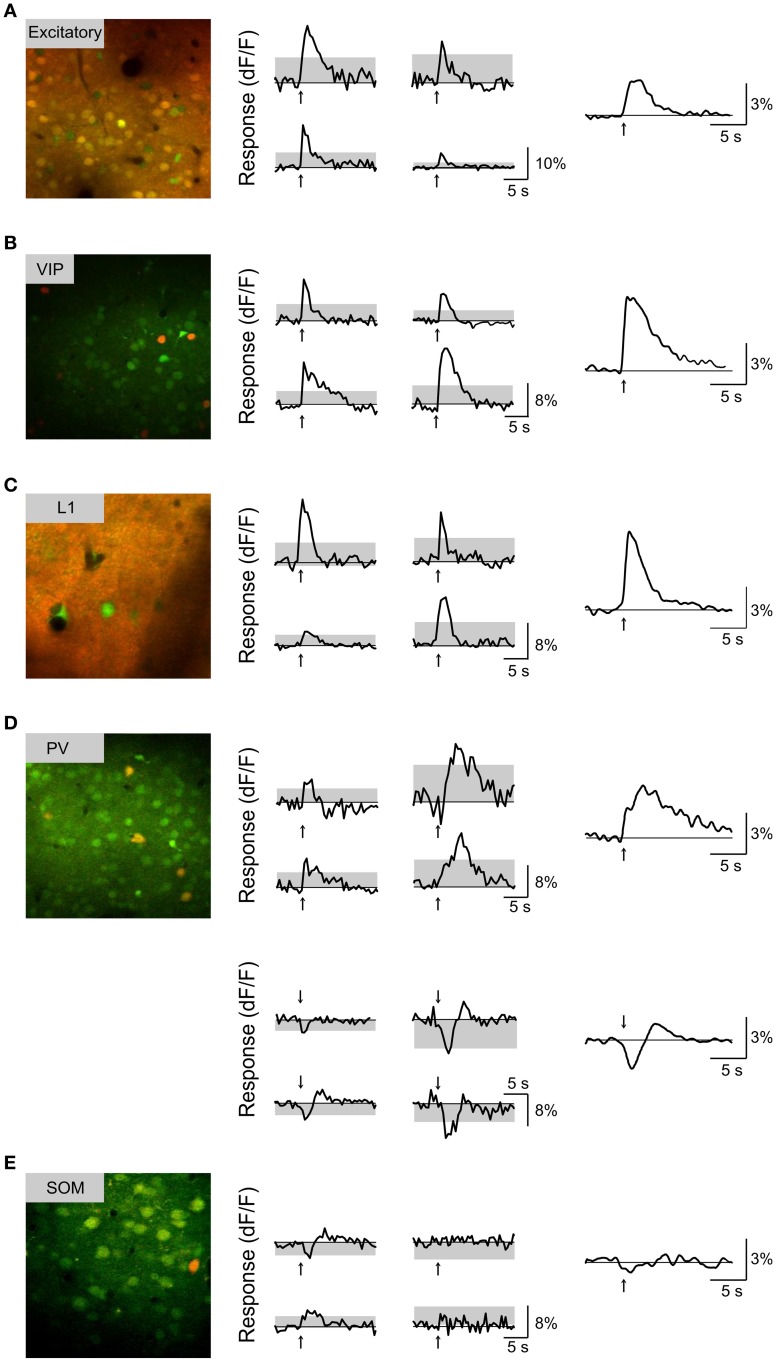
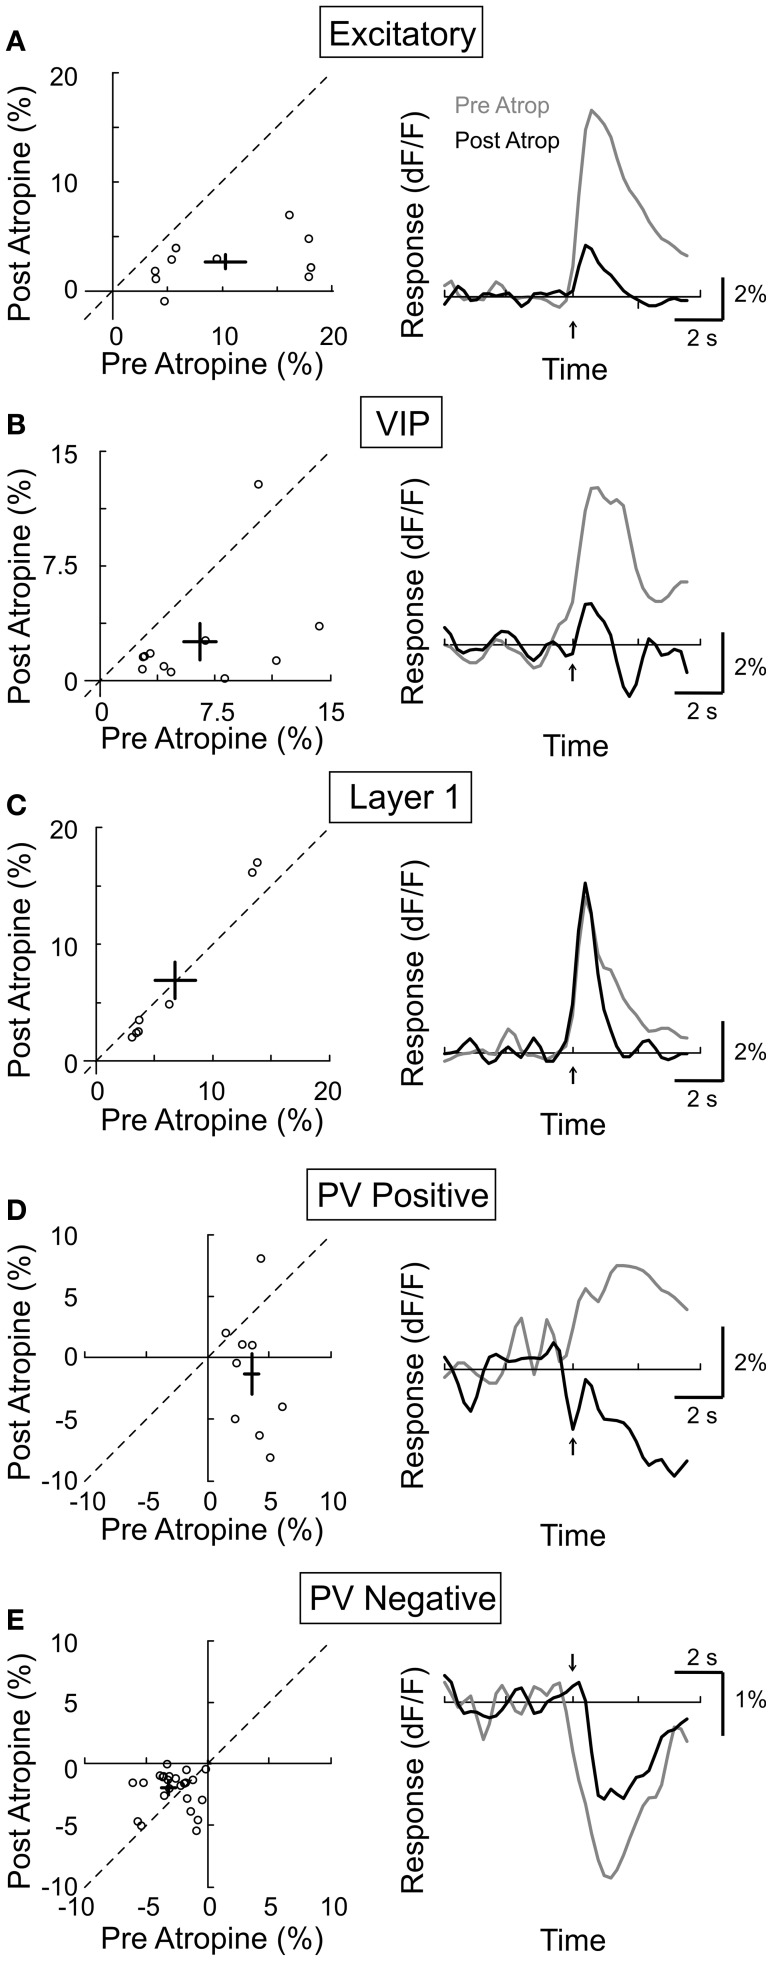
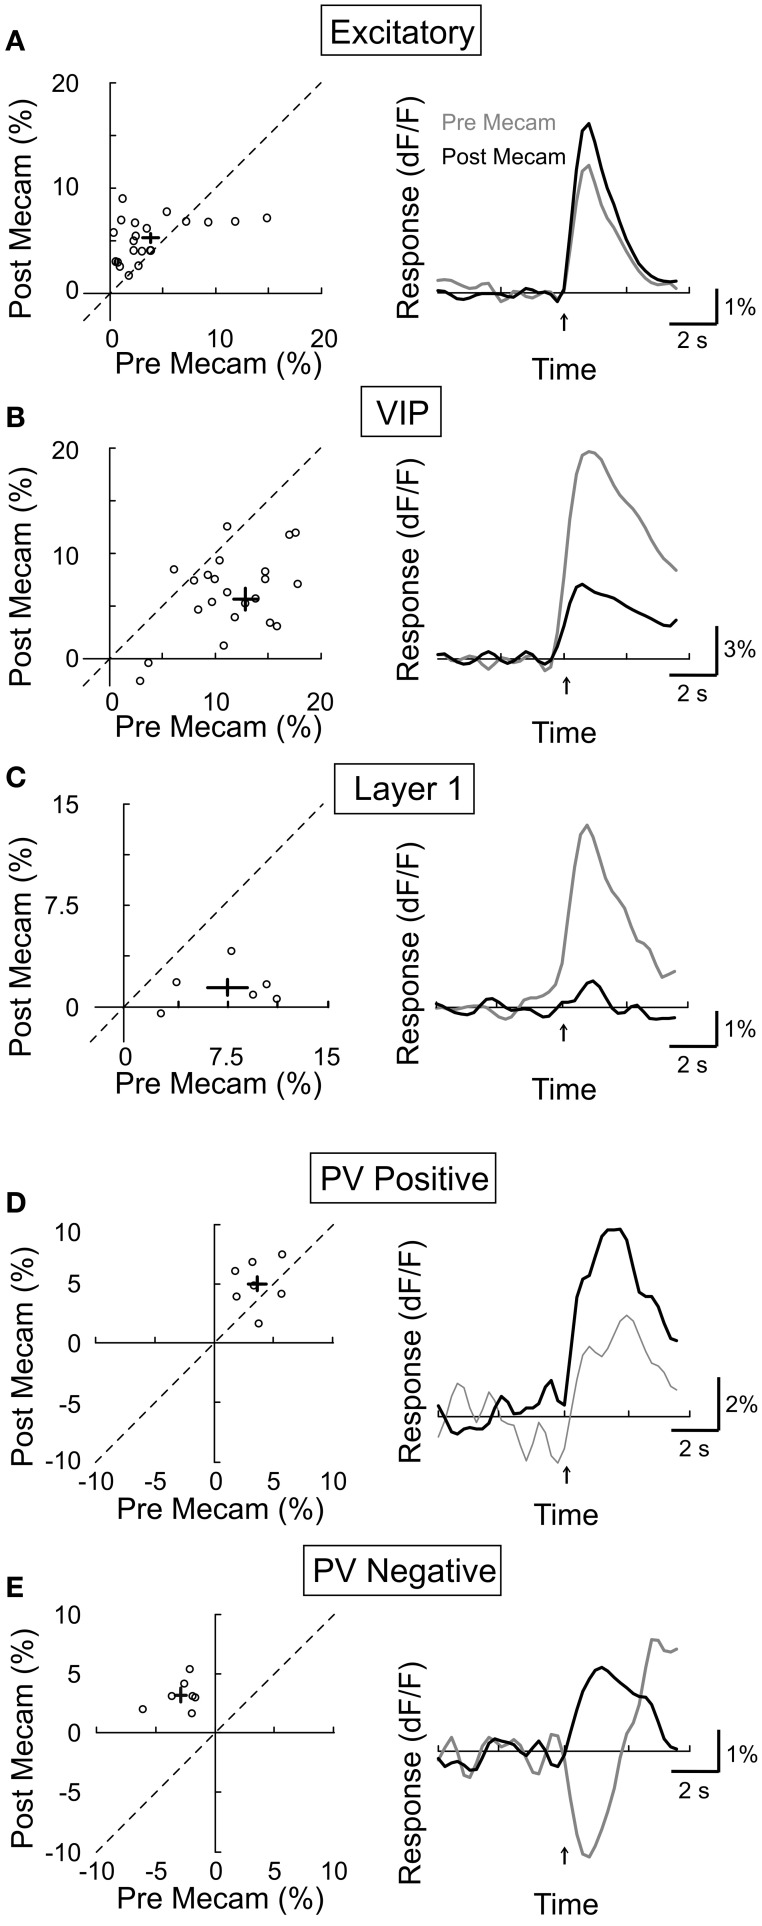
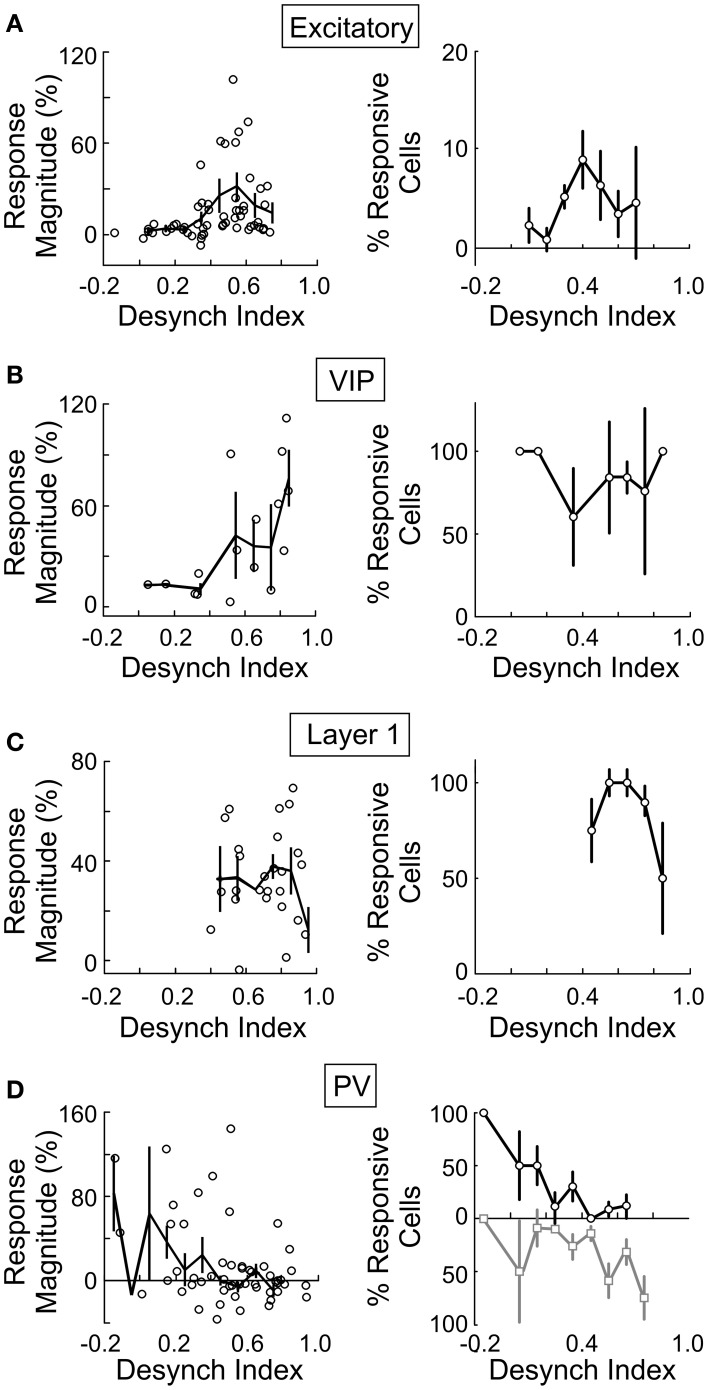
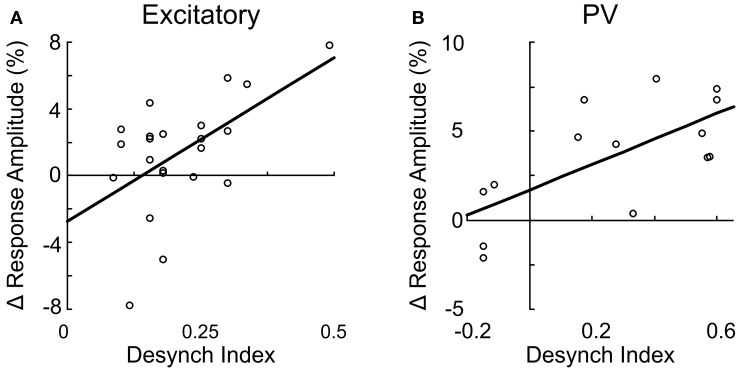
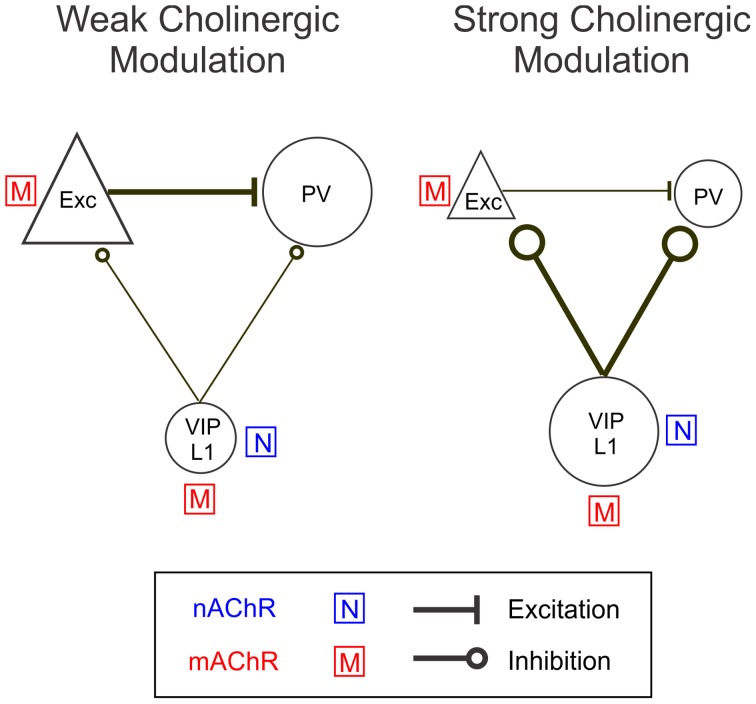
Activation of the cholinergic neurons in the basal forebrain (BF) desynchronizes cortical activity and enhances sensory processing during arousal and attention. How the cholinergic input modulates the activity of different subtypes of cortical neurons remains unclear. Using in vivo two-photon calcium imaging of neurons in layers 1 and 2/3 of mouse visual cortex, we show that electrical stimulation of the BF bi-directionally modulates the activity of excitatory neurons as well as several subtypes of inhibitory interneurons. While glutamatergic activity contributed to the activation of both excitatory and inhibitory neurons, the contribution of acetylcholine (ACh) was more complex. Excitatory and parvalbumin-positive (PV+) neurons were activated through muscarinic ACh receptors (mAChRs) at low levels of cortical desynchronization and suppressed through nicotinic ACh receptors (nAChRs) when cortical desynchronization was strong. In contrast, vasoactive intestinal peptide-positive (VIP+) and layer 1 interneurons were preferentially activated through nAChRs during strong cortical desynchronization. Thus, cholinergic input from the BF causes a significant shift in the relative activity levels of different subtypes of cortical neurons at increasing levels of cortical desynchronization.

Keywords: acetylcholine; layer 1; parvalbumin; vasoactive intestinal peptide; visual cortex.


Figures

Figure 1
Figure 1
Two-photon calcium imaging of basal forebrain modulation of cortical activity. (A) Schematic illustration of experimental design. (B) An example of cortical desynchronization induced by BF stimulation. Top left, EEG trace of a single trial. Bottom left, EEG spectrogram averaged from 10 trials; blue, low amplitude; red, high amplitude; black, period of BF stimulation; arrow, stimulus onset. Right, amplitude spectra during a 2 s period pre-(gray) and post-(black) stimulation, averaged from 10 stimulation trials. (C) An example fluorescence image of visual cortex loaded with OGB-1 (depth, 210 μm). (D) dF/F traces of four example cells (indicated by numbers in C) during a block of 10 trials of BF stimulation (arrows). Right, average response over the 10 trials. Gray shading, 4× SD of baseline. Cells 1 and 2 responded to BF stimulation with significant increases in calcium level, cell 3 showed a significant decrease, and cell 4 was not significantly modulated.
Figure 2
Figure 2
Basal forebrain modulation of excitatory and inhibitory cortical neurons. Shown is the percentage of significantly responsive neurons for each cell type. Black bar, significant positive response (dF/F > 4 × SD of baseline). Gray bar, significant negative response (dF/F < –4 × SD of baseline).
Figure 3
Figure 3
Basal forebrain modulation of each subtype of cortical neurons. (A) Left, Example fluorescence image from a CaMKIIα+ transgenic mouse (red, tdTomato; green, OGB-1). Middle, responses to BF stimulation (averaged from 10 trials) for four example neurons; arrow, stimulus onset; gray area, 4 × SD of baseline. Right, response averaged from all significantly responsive excitatory neurons (n = 71 positive dF/F responses, 34 negative dF/F responses). (B) Similar to (A), for VIP+ neurons (n = 50 positive). (C) Layer 1 neurons (n = 30 positive, 2 negative). (D) PV+ neurons with positive (top panel, n = 39) and negative (bottom panel, n = 33) responses. (E) SOM+ neurons (red, GFP; green, OGB-1; n = 47, 4 positive, 3 negative).
Figure 4
Figure 4
Basal forebrain modulation of cortical astrocytes. Left, astrocytes labeled with SR-101 in layer 1 (A) and layer 2/3 (B). Red, SR-101; green, OBG-1. Middle column, four example responsive astrocytes from each layer. Right, average response for all the significantly responsive astrocytes in each layer (black, positive; gray, negative).
Figure 5
Figure 5
Effect of atropine on BF modulation of cortical neurons. Left column, post-atropine vs. pre-atropine response amplitude (dF/F). Each symbol, one cell; error bar, ±SEM. Right column, average response from all responsive cells in each subtype; gray, pre-atropine; black, post-atropine. (A) Excitatory neurons, decreased by 77% post-atropine (p < 0.0001, n = 10). (B) VIP+, decreased by 62% (p < 0.01, n = 10). (C) Layer 1, no significant change (p = 0.45, n = 6). (D) PV+ with positive responses, decreased by 136% (p < 0.05, n = 9). (E) PV+ with negative responses, decreased by 38% (p < 0.05, n = 26).
Figure 6
Figure 6
Effect of mecamylamine on BF modulation of cortical neurons. Left column, post-mecamylamine vs. pre-mecamylamine response amplitude (dF/F). Each symbol, one cell; error bar, ±SEM. Right column, average response from all responsive cells in each subtype; gray, pre-mecamylamine; black, post-mecamylamine. (A) Excitatory neurons, increased 27% post-mecamylamine (p = 0.05, n = 23). (B) VIP+, decreased by 57% (p < 0.0001, n = 25). (C) Layer 1, decreased by 80% (p < 0.01, n = 6). (D) PV+ with positive responses, increased by 39% (p = 0.17, n = 7). (E) PV+ with negative responses, decreased by 210% (p < 0.001, n = 7).
Figure 7
Figure 7
Effect of CNQX on BF modulation of cortical neurons. Left column, post-CNQX vs. pre-CNQX response amplitude (dF/F). Each symbol, one cell; error bar, ±SEM. Right column, average response from all responsive cells in each subtype; gray, pre-CNQX; black, post-CNQX. (A) Excitatory neurons, decreased by 85% post-CNQX (p < 0.001, n = 14). (B) VIP+, decreased by 73% (p < 0.001, n = 14). (C) Layer 1, decreased by 53% (p < 0.0005, n = 16). (D) PV+ with positive responses, decreased by 131% (p < 0.0005, n = 4). (E) PV+ with negative responses, no significant change (p = 0.6, n = 4).
Figure 8
Figure 8
BF modulation of individual neurons is correlated with cortical desynchronization. For each cell type the response magnitude of significantly responsive cells (left column, each data point represents average from one experiment) and percentage of cells that were significantly responsive (right column) are plotted against the cortical desynchronization index (1 – EEG power Pre-Stim1–10 Hz/EEG power Post-Stim1–10 Hz), n = 145 experiments. (A) Excitatory cells. (B) VIP+ neurons. (C) Layer 1. (D) PV+ (black/gray, cells with positive/negative responses). Error bars, ± SEM.
Figure 9
Figure 9
Suppression of excitatory and PV+ neurons through nAChR is correlated with cortical desynchronization. The change in response amplitude after mecamylamine application is plotted against the desynchronization index for excitatory neurons (A, r = 0.55, p < 0.01) and PV+ interneurons (B, r = 0.73, p < 0.01). Each data point represents one neuron. Line, linear fit.
Figure 10
Figure 10
A model circuit of cholinergic modulation of cortical neurons. During weak cortical desynchronization muscarinic modulation is dominant, activating excitatory neurons directly and PV+ interneurons indirectly (through glutamatergic input from excitatory neurons). During strong cortical desynchronization nicotinic modulation becomes more pronounced, causing activation of VIP+ and layer 1 interneurons directly and a reduction in excitatory and PV+ neuron activity indirectly (through GABAergic inhibition from VIP+/layer 1 neurons). The sizes of the icons and thicknesses of connecting lines reflect the relative activity levels during weak and strong cortical desynchronization.

References

    1. Arroyo S., Bennett C., Aziz D., Brown S., Hestrin S. (2012). Prolonged disynaptic inhibition in the cortex mediated by slow, non-α 7 nicotinic excitation of a specific subset of cortical interneurons. J. Neurosci. 32, 3859–3923. 10.1523/JNEUROSCI.0115-12.2012 - DOI - PMC - PubMed
    1. Ascoli G. A., Alonso-Nanclares L., Anderson S. A., Barrionuevo G., Benavides-Piccione R., Burkhalter A., et al. . (2008). Petilla terminology: nomenclature of features of GABAergic interneurons of the cerebral cortex. Nat. Rev. Neurosci. 9, 557–568. 10.1038/nrn2402 - DOI - PMC - PubMed
    1. Bacci A., Huguenard J., Prince D. (2005). Modulation of neocortical interneurons: extrinsic influences and exercises in self-control. Trends Neurosci. 28, 602–612. 10.1016/j.tins.2005.08.007 - DOI - PubMed
    1. Beierlein M., Gibson J., Connors B. (2003). Two dynamically distinct inhibitory networks in layer 4 of the neocortex. J. Neurophysiol. 90, 2987–5987. 10.1152/jn.00283.2003 - DOI - PubMed
    1. Cao Y.-J., Surowy C., Puttfarcken P. (2005). Different nicotinic acetylcholine receptor subtypes mediating striatal and prefrontal cortical [3H]dopamine release. Neuropharmacology 48, 72–81. 10.1016/j.neuropharm.2004.09.005 - DOI - PubMed