

Resting-state functional connectivity in late-life depression: higher global connectivity and more long distance connections
- PMID: 23316175
- PMCID: PMC3540775
- DOI: 10.3389/fpsyt.2012.00116
Resting-state functional connectivity in late-life depression: higher global connectivity and more long distance connections
Abstract
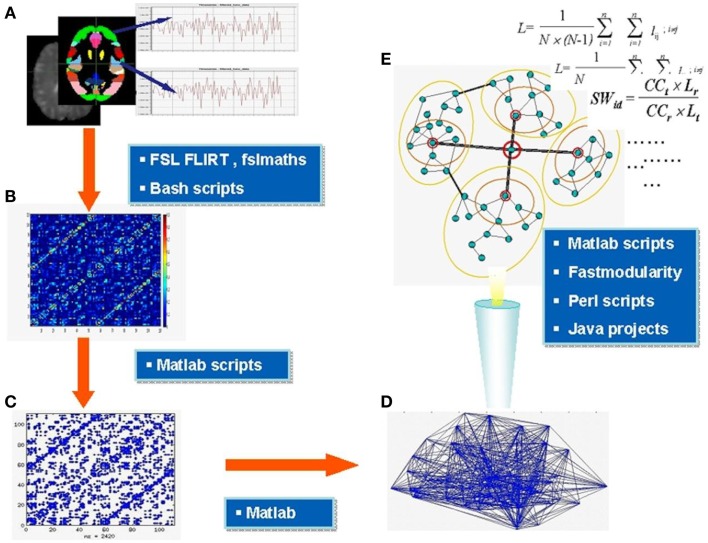
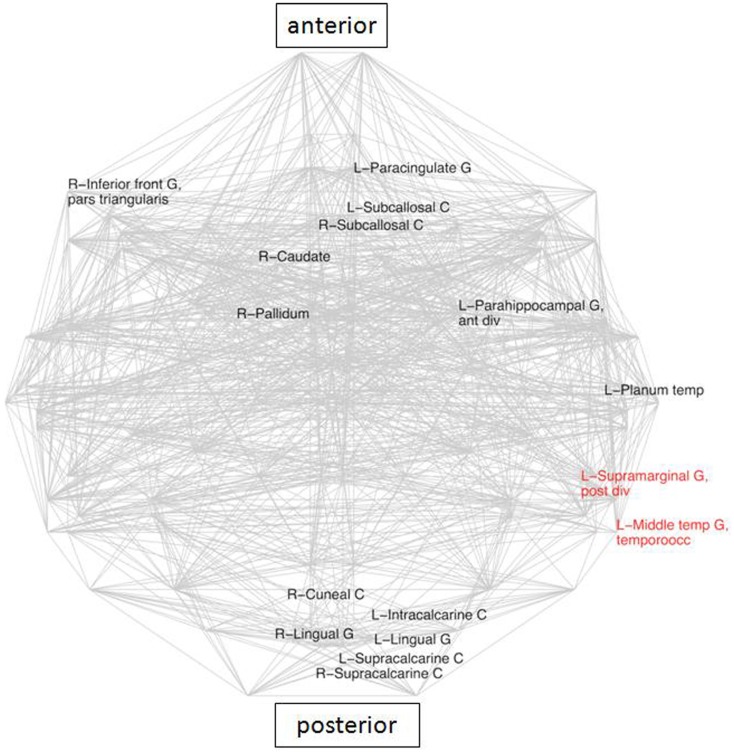
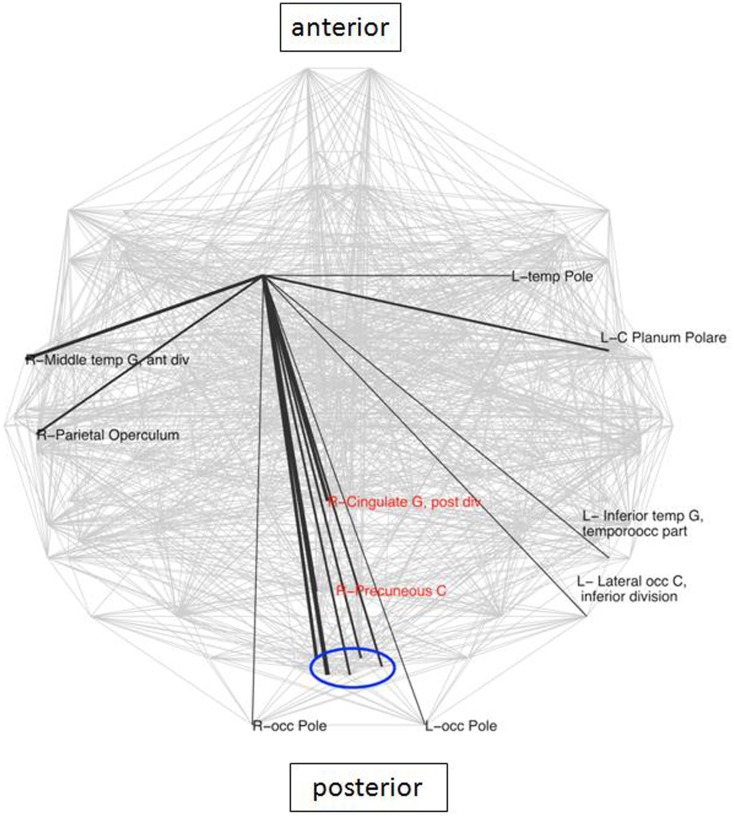
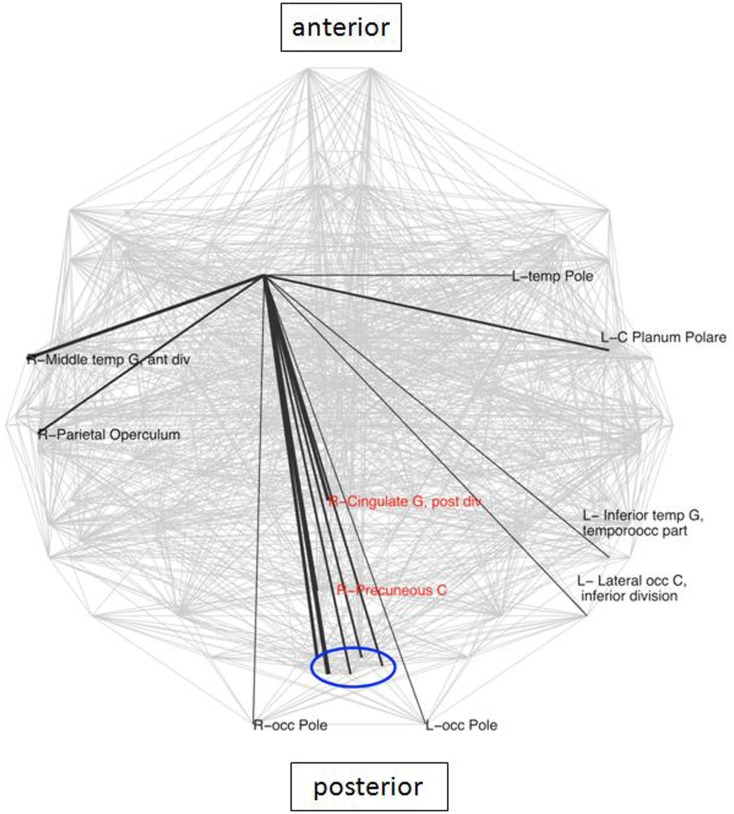
Functional magnetic resonance imaging recordings in the resting-state (RS) from the human brain are characterized by spontaneous low-frequency fluctuations in the blood oxygenation level dependent signal that reveal functional connectivity (FC) via their spatial synchronicity. This RS study applied network analysis to compare FC between late-life depression (LLD) patients and control subjects. Raw cross-correlation matrices (CM) for LLD were characterized by higher FC. We analyzed the small-world (SW) and modular organization of these networks consisting of 110 nodes each as well as the connectivity patterns of individual nodes of the basal ganglia. Topological network measures showed no significant differences between groups. The composition of top hubs was similar between LLD and control subjects, however in the LLD group posterior medial-parietal regions were more highly connected compared to controls. In LLD, a number of brain regions showed connections with more distant neighbors leading to an increase of the average Euclidean distance between connected regions compared to controls. In addition, right caudate nucleus connectivity was more diffuse in LLD. In summary, LLD was associated with overall increased FC strength and changes in the average distance between connected nodes, but did not lead to global changes in SW or modular organization.
Keywords: aging; default mode network; functional connectivity; functional magnetic resonance; graph theory; late-life depression; network analysis; resting-state.
Figures
Similar articles
-
Amygdala network dysfunction in late-life depression phenotypes: Relationships with symptom dimensions.J Psychiatr Res. 2015 Nov;70:121-9. doi: 10.1016/j.jpsychires.2015.09.002. Epub 2015 Sep 9. J Psychiatr Res. 2015. PMID: 26424431 Free PMC article.
-
Are resting-state network alterations in late-life depression related to synaptic density? Findings of a combined 11C-UCB-J PET and fMRI study.Cereb Cortex. 2025 Mar 6;35(3):bhaf028. doi: 10.1093/cercor/bhaf028. Cereb Cortex. 2025. PMID: 40072885
-
Task-based functional connectivity reveals aberrance with the salience network during emotional interference in late-life depression.Aging Ment Health. 2023 Sep-Oct;27(10):2043-2051. doi: 10.1080/13607863.2023.2179972. Epub 2023 Mar 13. Aging Ment Health. 2023. PMID: 36914245
-
The structural and functional connectivity of the posterior cingulate cortex: comparison between deterministic and probabilistic tractography for the investigation of structure-function relationships.Neuroimage. 2014 Nov 15;102 Pt 1:118-27. doi: 10.1016/j.neuroimage.2013.12.022. Epub 2013 Dec 21. Neuroimage. 2014. PMID: 24365673 Review.
-
Brain network dysfunction in late-life depression: a literature review.J Geriatr Psychiatry Neurol. 2014 Mar;27(1):5-12. doi: 10.1177/0891988713516539. Epub 2013 Dec 30. J Geriatr Psychiatry Neurol. 2014. PMID: 24381233 Review.
Cited by
-
Disrupted small world topology and modular organisation of functional networks in late-life depression with and without amnestic mild cognitive impairment.J Neurol Neurosurg Psychiatry. 2015 Oct;86(10):1097-105. doi: 10.1136/jnnp-2014-309180. Epub 2014 Nov 28. J Neurol Neurosurg Psychiatry. 2015. PMID: 25433036 Free PMC article.
-
Altered brain network modules induce helplessness in major depressive disorder.J Affect Disord. 2014 Oct;168:21-9. doi: 10.1016/j.jad.2014.05.061. Epub 2014 Jul 1. J Affect Disord. 2014. PMID: 25033474 Free PMC article.
-
Focal application of accelerated iTBS results in global changes in graph measures.Hum Brain Mapp. 2019 Feb 1;40(2):432-450. doi: 10.1002/hbm.24384. Epub 2018 Oct 1. Hum Brain Mapp. 2019. PMID: 30273448 Free PMC article. Clinical Trial.
-
Multimodal brain connectivity analysis in unmedicated late-life depression.PLoS One. 2014 Apr 24;9(4):e96033. doi: 10.1371/journal.pone.0096033. eCollection 2014. PLoS One. 2014. PMID: 24763508 Free PMC article.
-
Divergent brain functional network alterations in dementia with Lewy bodies and Alzheimer's disease.Neurobiol Aging. 2015 Sep;36(9):2458-67. doi: 10.1016/j.neurobiolaging.2015.05.015. Epub 2015 Jun 2. Neurobiol Aging. 2015. PMID: 26115566 Free PMC article.
References
-
- Floyd R. W. (1962). Algorithm 97: shortest path. Commun. ACM 5, 345.10.1145/368959.368993 - DOI
LinkOut - more resources
Full Text Sources
Other Literature Sources