. 2013 Jan 9:3:413.
doi: 10.3389/fimmu.2012.00413. eCollection 2012.

Automatic quantification of in vitro NET formation

Affiliations

Automatic quantification of in vitro NET formation

Volker Brinkmann et al. Front Immunol. .

Abstract

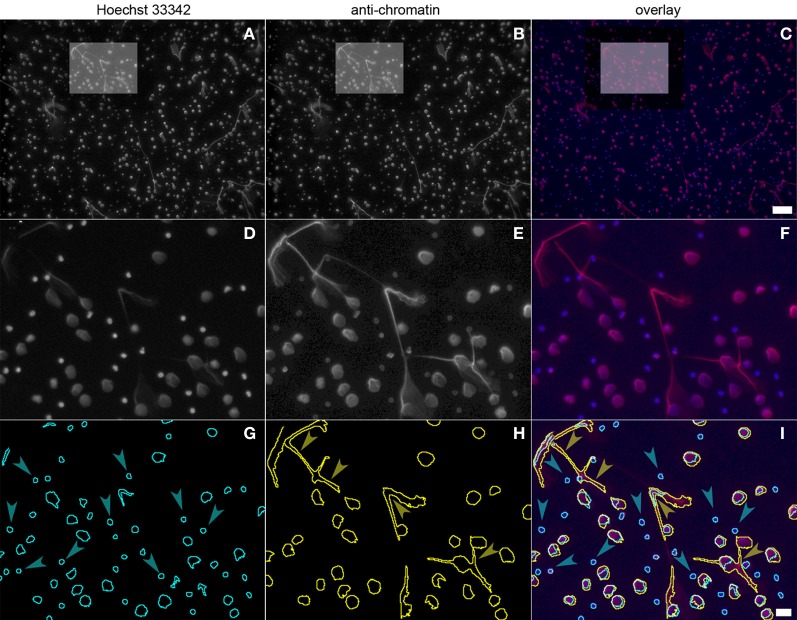
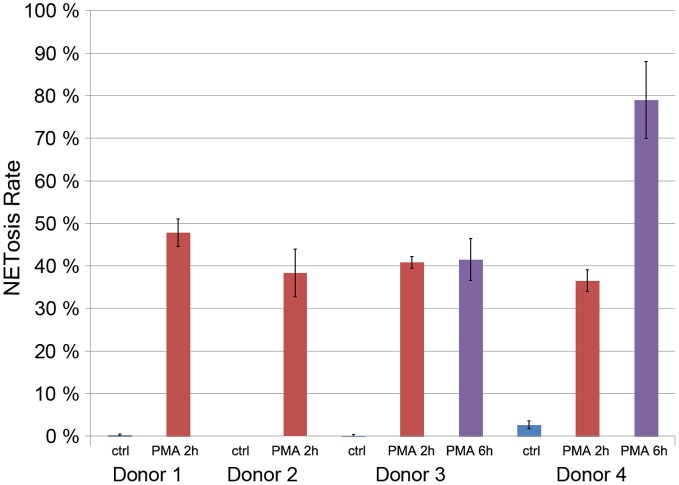
Neutrophil Extracellular Traps (NETs) consist of decondensed chromatin studded with granular and some cytoplasmic proteins. They are formed by activated neutrophil granulocytes, also called polymorphonuclear leukocytes (PMN) as the result of an active cell death program, named NETosis. NETosis can be induced by a wide range of stimuli including coculture of neutrophils with pathogens (bacteria, fungi, parasites, virus particles), activated platelets, or pathogen components. The first step of the NETotic cascade is stimulation of one or several receptors followed by activation of the Raf/MEK/ERK pathway that culminates in the assembly of the multimeric NADPH oxidase complex and the production of reactive oxygen species (ROS). Later, intracellular membranes disintegrate, the granular protein Neutrophil Elastase enters the nucleus and processes core histones that also get hypercitrullinated. This leads to decondensation and mobilization of chromatin. The amount of NET formation varies with the degree of stimulation, and this is dependent on the type and concentration of the stimulus. NETs can be quantified using various methods including fluorescence microscopy or measuring DNA release. Each of these methods have specific drawbacks: analysis of fluorescence microscopy is prone to subjective variations, and DNA release does not differentiate between DNA that has been released by NETosis or by other forms of cell death. Here we present a protocol to semi-automatically quantify NET formation. It relies on the observation that anti-chromatin antibodies bind more readily to decondensed chromatin present in the nuclei of cells undergoing NETosis and in the NETs. Relating the fluorescence signals of the anti-chromatin antibody to the signals of a DNA-binding dye allows the automatic calculation of the percentage of netting neutrophils. This method does not require sophisticated microscopic equipment, and the images are quantified with a public-domain software package.

Keywords: NEtosis; chromatin; immunofluorescence; quantification; segmentation.


Figures

Figure 1
Figure 1
Immunofluorescence analysis of unstimulated neutrophils (A) and neutrophils stimulated with 50 nM PMA for 10'(B), 40'(C), and 130' (D). Blue: DNA (Hoechst 33342), red: chromatin (antibody PL2-3), green: Neutrophil Elastase. Bar represents 20 μm. Panels 1E–H show line plot quantifications of DNA and chromatin fluorescence intensity of individual cells depicted in panels 1A–D.
Figure 2
Figure 2
Size (right y-axis) and staining intensities (left y-axis) of automatically segmented objects in images of chromatin- and Hoechst33342- stained cells from a time course of PMA induced NETosis. One image with 47 objects (avg.) per timepoint was measured. Staining intensity plotted as means per timepoint of the maximum intensity-value in each object.
Figure 3
Figure 3
Neutrophils stimulated with PMA for 130 min and stained with Hoechst 33342 (panel 3A, boxed area panel 3D) and PL2-3 (panel 3B, boxed area panel 3E). The overlap is shown in panel 3C (blue, DNA; red, chromatin; boxed area in panel 3F). Automatic segmentation of the fluorescence signals is shown in panel 3G (blue, DNA) and panel 3H (yellow, chromatin). The overlay of the segmentations and the fluorescence signals is depicted in panel 3I. Bars represent 100 μm for (A–C) and 20 μm for (D–I).
Figure 4
Figure 4
Quantification of the NETosis rate of neutrophils from for donors unstimulated (blue) and stimulated with 50 nM PMA for 2 h (red) or 6 h (violet, only donors 3 and 4).
Figure 5
Figure 5
NETosis rates of ligands of Toll-like receptors (CpG, Flagellin, panel 5A and BLP, panel 5B) as well as NETosis rate of neutrophils cocultured with Pseudomonas aergunisosa (panel 5C).
Figure 6
Figure 6
Quantification of NET induction by monosodium urate (MSU) and silica particles.
Figure 7
Figure 7
NETosis rate of neutrophils treated for 10 min and 6 h for with proinflammatory cytokines (TNF-α, G-CSF, and IL-1β).

References

    1. Abdallah D. S. A., Lin C. Y., Ball C. J., King M. R., Duhamel G. E., Denkers E. Y. (2012). Toxoplasma gondii triggers release of human and mouse neutrophil extracellular traps. Infect. Immun. 80, 768–777 10.1128/IAI.05730-11 - DOI - PMC - PubMed
    1. Aga E., Katschinski D. M., van Zandbergen G., Laufs H., Hansen B., Muller K., et al. (2002). Inhibition of the spontaneous apoptosis of neutrophil granulocytes by the intracellular parasite Leishmania major. J. Immunol. 169, 898–905 - PubMed
    1. Aliprantis A. O., Yang R. B., Mark M. R., Suggett S., Devaux B., Radolf J. D., et al. (1999). Cell activation and apoptosis by bacterial lipoproteins through toll-like receptor-2. Science 285, 736–739 10.1126/science.285.5428.736 - DOI - PubMed
    1. Aulik N. A., Hellenbrand K. M., Klos H., Czuprynski C. J. (2010). Mannheimia haemolytica and its leukotoxin cause neutrophil extracellular trap formation by bovine neutrophils. Infect. Immun. 78, 4454–4466 10.1128/IAI.00840-10 - DOI - PMC - PubMed
    1. Bauer S., Kirschning C. J., Hacker H., Redecke V., Hausmann S., Akira S., et al. (2001). Human TLR9 confers responsiveness to bacterial DNA via species-specific CpG motif recognition. Proc. Natl. Acad. Sci. U.S.A. 98, 9237–9242 10.1073/pnas.161293498 - DOI - PMC - PubMed