

Impact of global normalization in FMRI acupuncture studies
- PMID: 23316257
- PMCID: PMC3534243
- DOI: 10.1155/2012/467061
Impact of global normalization in FMRI acupuncture studies
Abstract
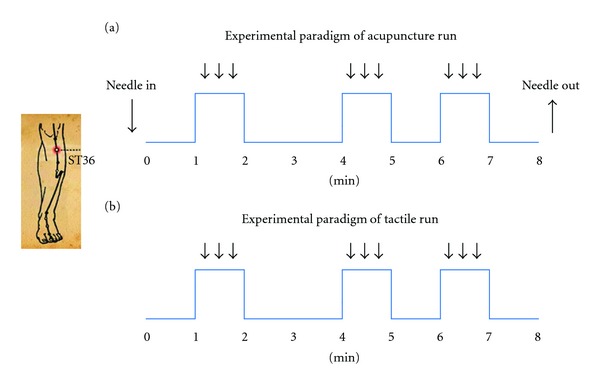
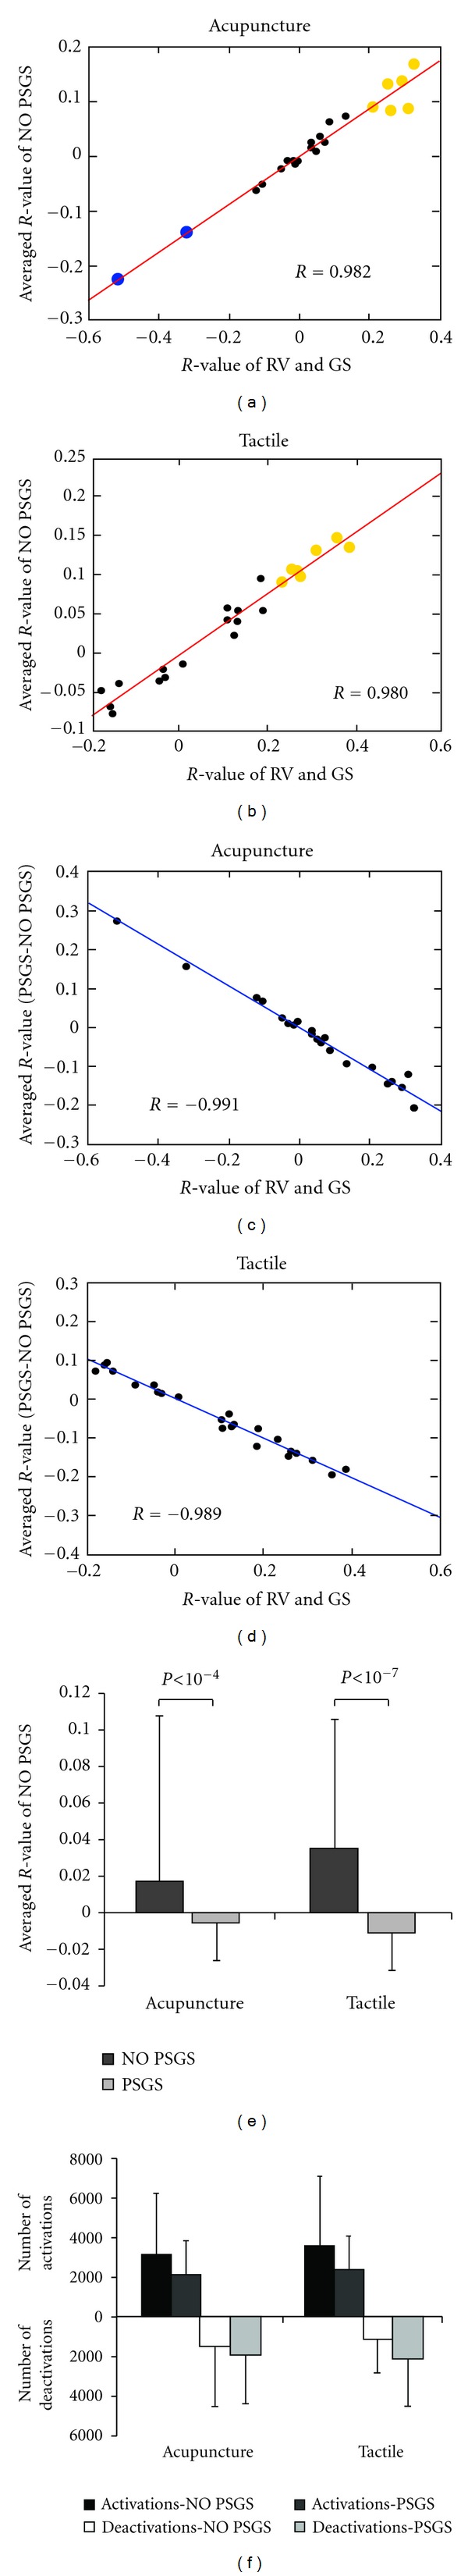
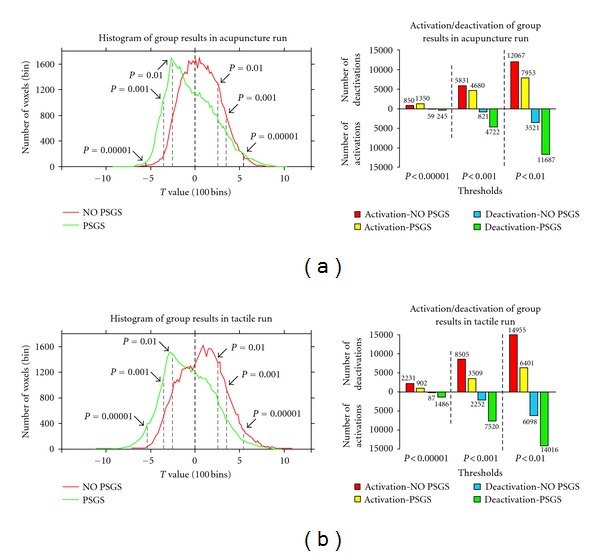
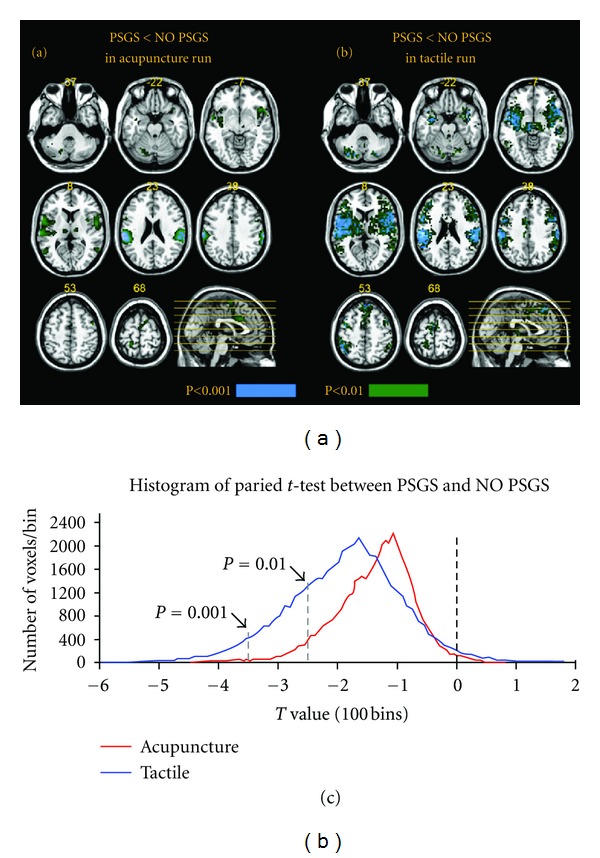
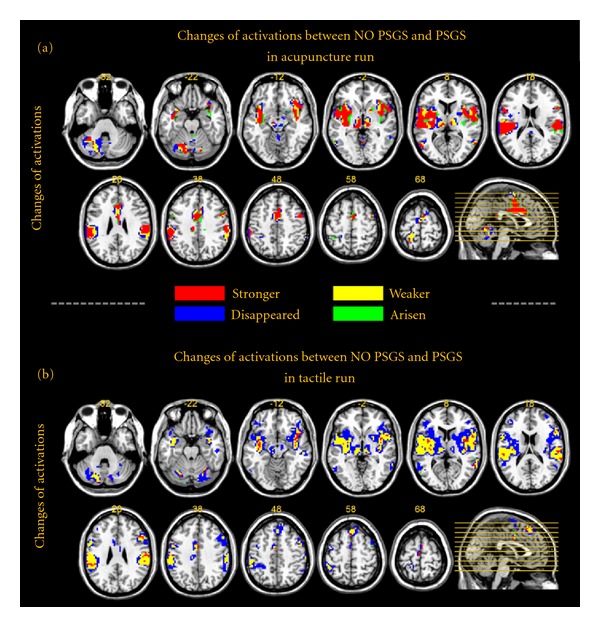
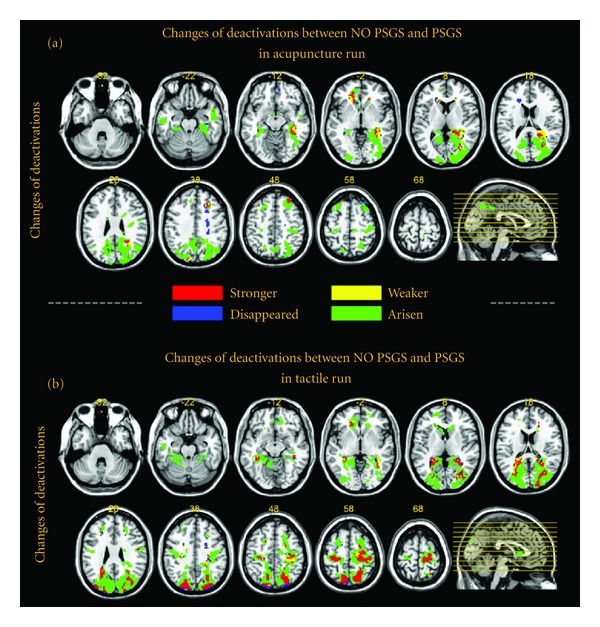
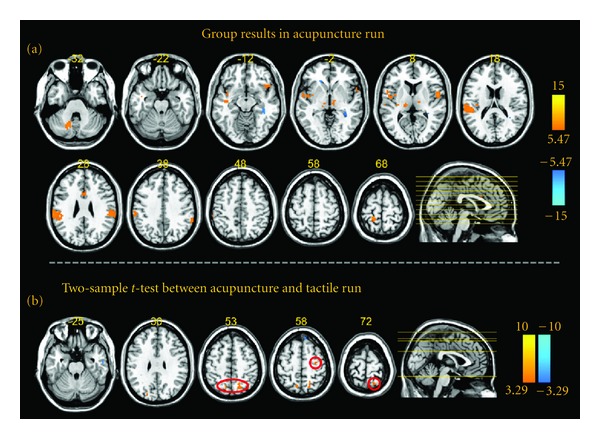
Global normalization is often used as a preprocessing step for dispelling the "nuisance effects." However, it has been shown in cognitive and emotion tasks that this preprocessing step might greatly distort statistical results when the orthogonality assumption of global normalization is violated. The present study examines this issue in fMRI acupuncture studies. Thirty healthy subjects were recruited to evaluate the impacts of the global normalization on the BOLD responses evoked by acupuncture stimulation during De-qi sensation and tactile stimulation during nonpainful sensations. To this end, we compared results by conducting global normalization (PSGS) and not conducting global normalization (NO PSGS) based on a proportional scaling model. The orthogonality assumption of global normalization was violated, and significant changes between BOLD responses for NO PSGS and PSGS were shown in most subjects. Extensive deactivations of acupuncture in fMRI were the non-specifically pernicious consequences of global normalization. The central responses of acupuncture during De-qi are non-specifically activation-dominant at the somatosensory-related brain network, whose statistical power is specifically enhanced by PSGS. In conclusion, PSGS should be unjustified for acupuncture studies in fMRI. The differences including the global normalization or not may partly contribute to conflicting results and interpretations in previous fMRI acupuncture studies.
Figures
Similar articles
-
What Is the de-qi-Related Pattern of BOLD Responses? A Review of Acupuncture Studies in fMRI.Evid Based Complement Alternat Med. 2013;2013:297839. doi: 10.1155/2013/297839. Epub 2013 Feb 7. Evid Based Complement Alternat Med. 2013. PMID: 23476685 Free PMC article.
-
Neuroimaging of emotion: empirical effects of proportional global signal scaling in fMRI data analysis.Neuroimage. 2005 Apr 1;25(2):520-6. doi: 10.1016/j.neuroimage.2004.12.011. Neuroimage. 2005. PMID: 15784431
-
Partly Separated Activations in the Spatial Distribution between de-qi and Sharp Pain during Acupuncture Stimulation: An fMRI-Based Study.Evid Based Complement Alternat Med. 2012;2012:934085. doi: 10.1155/2012/934085. Epub 2012 Dec 24. Evid Based Complement Alternat Med. 2012. PMID: 23326294 Free PMC article.
-
Effects of acupuncture needling with specific sensation on cerebral hemodynamics and autonomic nervous activity in humans.Int Rev Neurobiol. 2013;111:25-48. doi: 10.1016/B978-0-12-411545-3.00002-X. Int Rev Neurobiol. 2013. PMID: 24215916 Review.
-
[Progress of fMRI-based deqi research in recent 10 years].Zhongguo Zhen Jiu. 2018 Apr 12;38(4):445-50. doi: 10.13703/j.0255-2930.2018.04.029. Zhongguo Zhen Jiu. 2018. PMID: 29696933 Review. Chinese.
Cited by
-
Improved performance of fNIRS-BCI by stacking of deep learning-derived frequency domain features.PLoS One. 2025 Apr 17;20(4):e0314447. doi: 10.1371/journal.pone.0314447. eCollection 2025. PLoS One. 2025. PMID: 40245060 Free PMC article.
-
Brain responses to acupuncture are probably dependent on the brain functional status.Evid Based Complement Alternat Med. 2013;2013:175278. doi: 10.1155/2013/175278. Epub 2013 May 21. Evid Based Complement Alternat Med. 2013. PMID: 23737817 Free PMC article.
-
Effect of acupuncture at ST36 on motor cortical excitation and inhibition.Brain Behav. 2019 Sep;9(9):e01370. doi: 10.1002/brb3.1370. Epub 2019 Jul 30. Brain Behav. 2019. PMID: 31359627 Free PMC article.
-
What Is the de-qi-Related Pattern of BOLD Responses? A Review of Acupuncture Studies in fMRI.Evid Based Complement Alternat Med. 2013;2013:297839. doi: 10.1155/2013/297839. Epub 2013 Feb 7. Evid Based Complement Alternat Med. 2013. PMID: 23476685 Free PMC article.
-
Modulatory effects of acupuncture on brain networks in mild cognitive impairment patients.Neural Regen Res. 2017 Feb;12(2):250-258. doi: 10.4103/1673-5374.200808. Neural Regen Res. 2017. PMID: 28400807 Free PMC article.
References
-
- Beissner F, Deichmann R, Henke C, Bär K-J. Acupuncture—deep pain with an autonomic dimension? NeuroImage. 2012;60(1):653–660. - PubMed
-
- Hui KKS, Liu J, Marina O, et al. The integrated response of the human cerebro-cerebellar and limbic systems to acupuncture stimulation at ST 36 as evidenced by fMRI. NeuroImage. 2005;27(3):479–496. - PubMed
LinkOut - more resources
Full Text Sources
