. 2012 Oct;1(5):e004093.
doi: 10.1161/JAHA.112.004093. Epub 2012 Oct 25.

Hydrogen sulfide stimulates ischemic vascular remodeling through nitric oxide synthase and nitrite reduction activity regulating hypoxia-inducible factor-1α and vascular endothelial growth factor-dependent angiogenesis

Affiliations

Hydrogen sulfide stimulates ischemic vascular remodeling through nitric oxide synthase and nitrite reduction activity regulating hypoxia-inducible factor-1α and vascular endothelial growth factor-dependent angiogenesis

Shyamal C Bir et al. J Am Heart Assoc. 2012 Oct.

Abstract

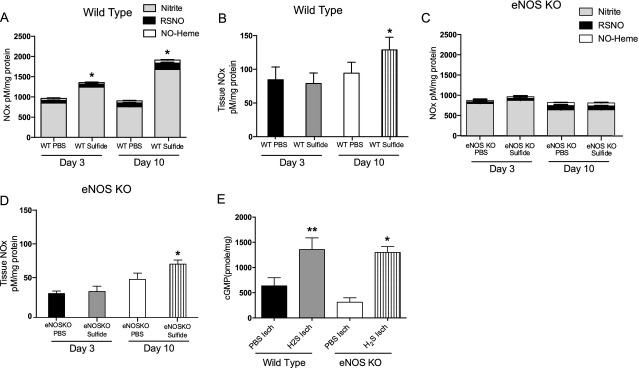
Background: Hydrogen sulfide (H(2)S) therapy is recognized as a modulator of vascular function during tissue ischemia with the notion of potential interactions of nitric oxide (NO) metabolism. However, little is known about specific biochemical mechanisms or the importance of H(2)S activation of NO metabolism during ischemic tissue vascular remodeling. The goal of this study was to determine the effect of H(2)S on NO metabolism during chronic tissue ischemia and subsequent effects on ischemic vascular remodeling responses.

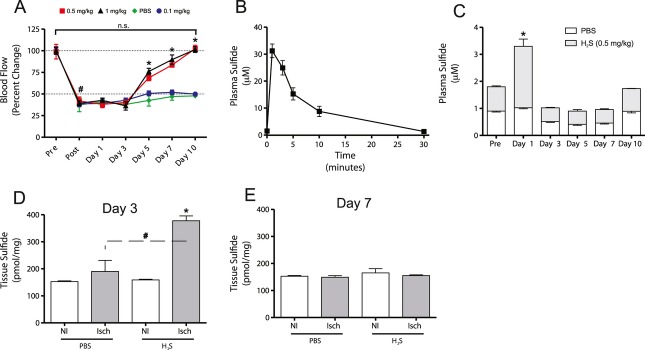
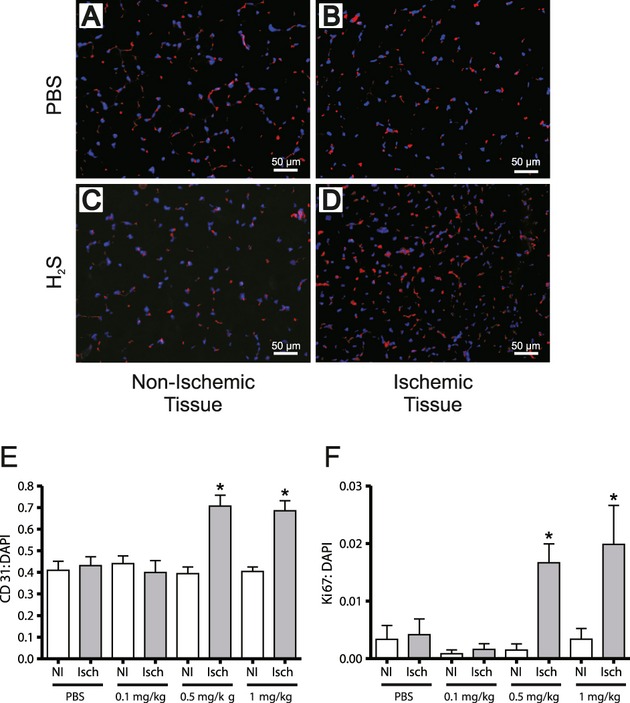
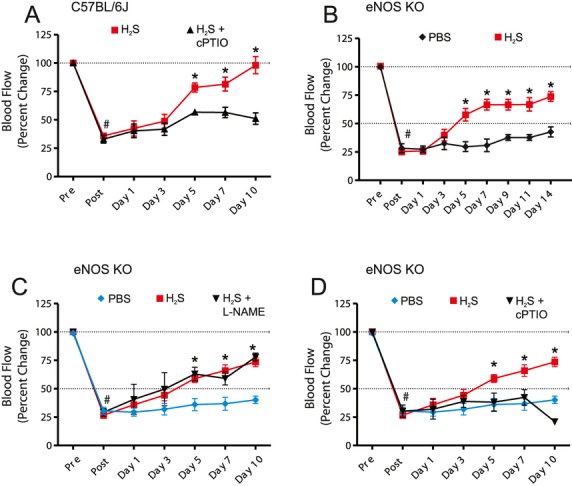
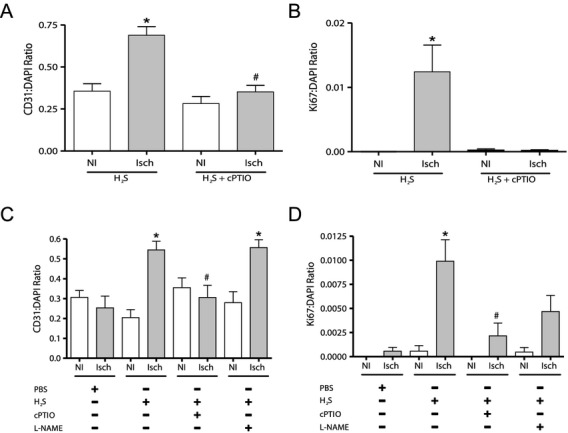
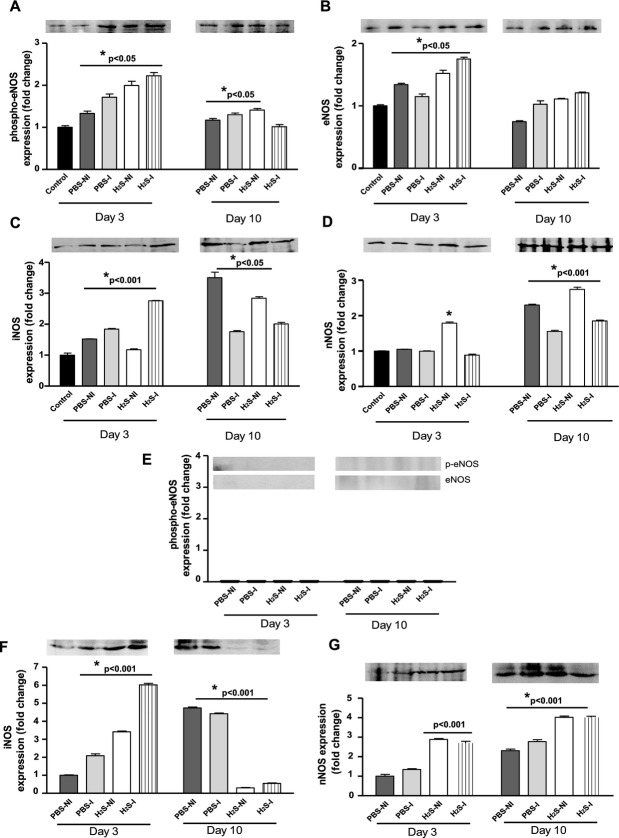
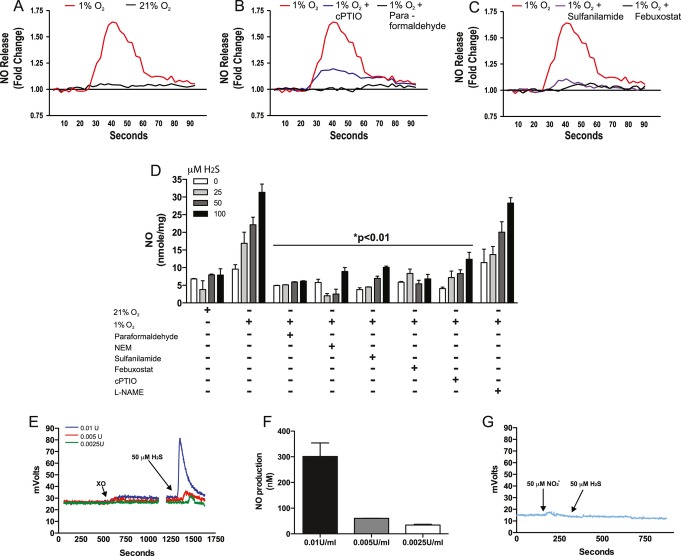
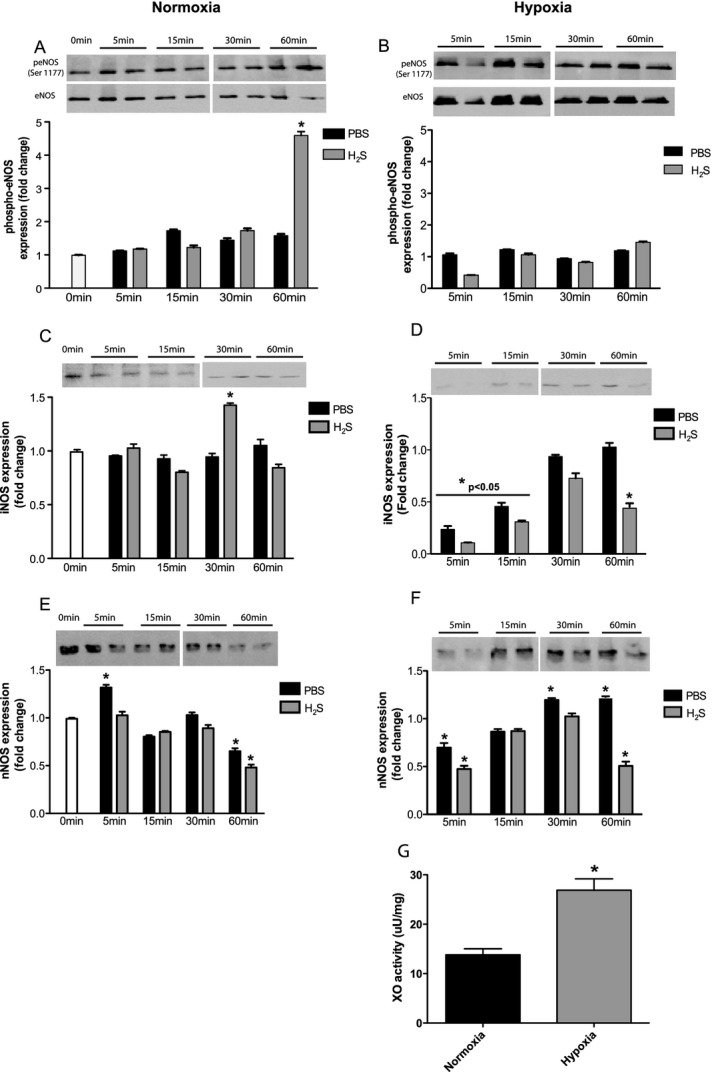
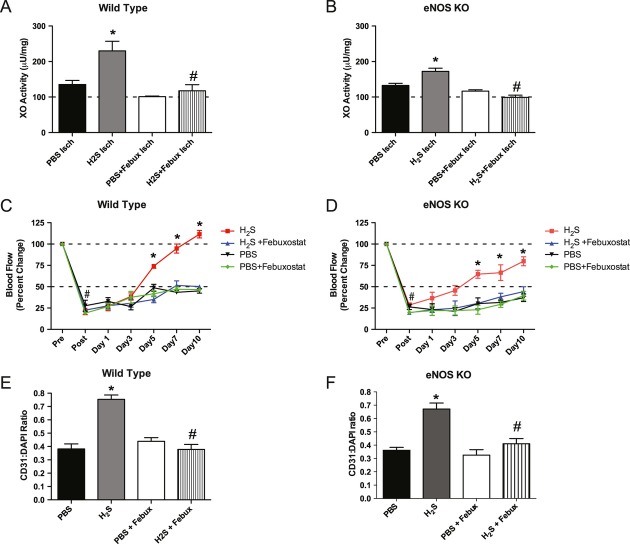
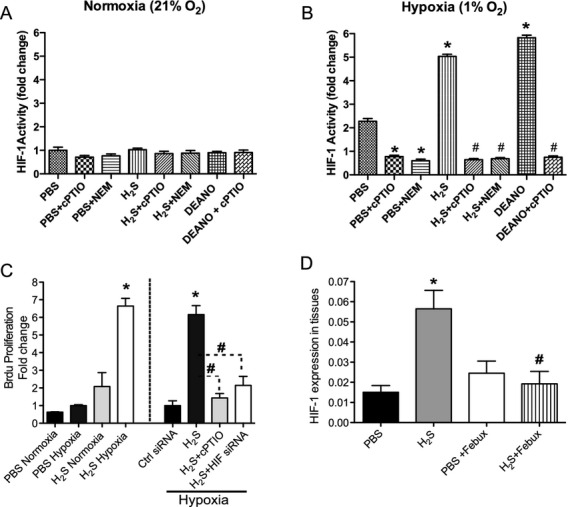
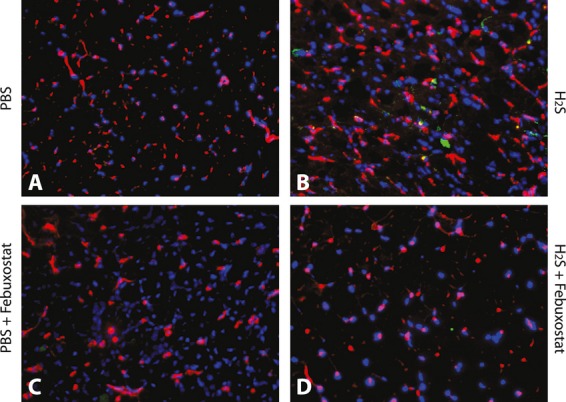
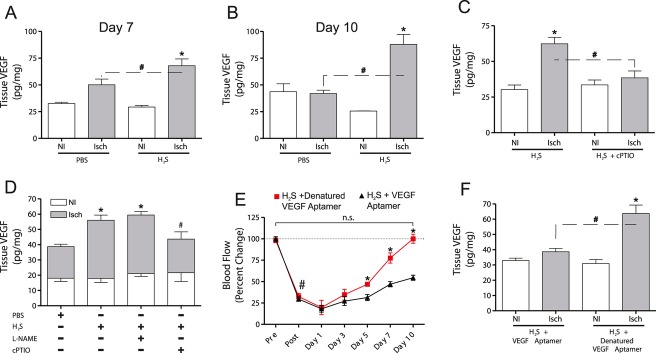
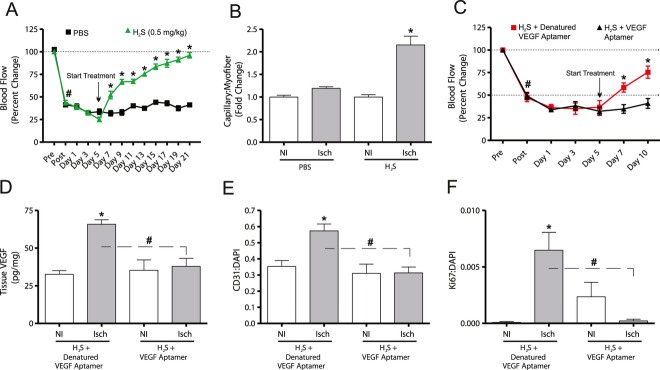
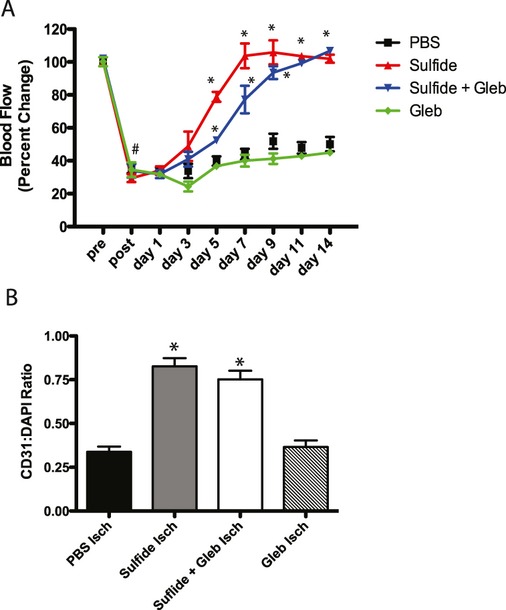
Methods and results: The unilateral, permanent femoral artery ligation model of hind-limb ischemia was performed in C57BL/6J wild-type and endothelial NO synthase-knockout mice to evaluate exogenous H(2)S effects on NO bioavailability and ischemic revascularization. We found that H(2)S selectively restored chronic ischemic tissue function and viability by enhancing NO production involving both endothelial NO synthase and nitrite reduction mechanisms. Importantly, H(2)S increased ischemic tissue xanthine oxidase activity, hind-limb blood flow, and angiogenesis, which were blunted by the xanthine oxidase inhibitor febuxostat. H(2)S treatment increased ischemic tissue and endothelial cell hypoxia-inducible factor-1α expression and activity and vascular endothelial growth factor protein expression and function in a NO-dependent manner that was required for ischemic vascular remodeling.

Conclusions: These data demonstrate that H(2)S differentially regulates NO metabolism during chronic tissue ischemia, highlighting novel biochemical pathways to increase NO bioavailability for ischemic vascular remodeling.

Keywords: angiogenesis; ischemia; nitric oxide; vascular endothelial growth factor; xanthine oxidase.


Figures

Figure 1.
Figure 1.
H2S restores blood flow in permanent femoral artery ligation–induced hind‐limb ischemia. A, Ischemic hind‐limb blood flow changes with increasing concentrations of sodium sulfide. B, Free plasma H2S levels after a single bolus injection of 0.5 mg/kg sodium sulfide. C, Steady‐state free plasma levels of H2S during the course of therapy. D, Tissue free H2S levels in ischemic (Isch) and nonischemic (NI) tissues at day 3 after ligation. E, Tissue free H2S levels in ischemic and nonischemic tissues at day 7 after ligation. n=12 animals per experimental cohort, *P<0.05 compared to control or nonischemic limb data; #P<0.05 ischemic limb comparison between PBS and H2S, or before and after ligation.
Figure 2.
Figure 2.
H2S enhances ischemic vascular density and cellular proliferation. A and B, Tissue sections from PBS‐treated animals both nonischemic and ischemic, respectively, stained for DAPI (blue) and CD31 (red) at day 10. C and D, Tissue sections from 0.5 mg/kg sodium sulfide–treated animals both nonischemic and ischemic, respectively, stained for DAPI (blue) and CD31 (red) at day 10. E, Graphical representation of the CD31:DAPI ratio (red:blue) demonstrating vascular density in different gastrocnemius tissues from sodium sulfide–treated mice. F, Graphical representation of Ki67:DAPI ratio (green:blue) demonstrating proliferation in different gastrocnemius tissues from sodium sulfide–treated mice. NI indicates nonischemic; Isch, ischemic. n=12 animals per cohort, *P<0.05 compared to PBS ischemic tissue data.
Figure 3.
Figure 3.
Role of NO and eNOS in H2S restoration of ischemic limb blood flow. A, Blood flow from wild‐type animals after sodium sulfide (0.5 mg/kg) therapy with and without cPTIO (1 mg/kg) to scavenge NO. B, Blood flow from eNOS‐knockout (eNOS KO) animals with sodium sulfide therapy (0.5 mg/kg). C, Blood flow results from sodium sulfide–treated eNOS−/− animals plus 5 mg/kg L‐NAME (NOS inhibitor). D, Blood flow results from sodium sulfide–treated eNOS‐knockout animals plus 1 mg/kg cPTIO (NO scavenger). n=12, #P<0.05 compared from before to after ligation, *P<0.05 compared to either H2S+cPTIO or PBS controls.
Figure 4.
Figure 4.
H2S enhances vascular density in eNOS−/− mice. A and B, Graphical representation of the CD31:DAPI and Ki67:DAPI ratios demonstrating vascular density and proliferation responses in wild‐type mice treated with cPTIO. C and D, Vascular density and proliferation data of gastrocnemius tissues from eNOS−/− mice under H2S, cPTIO, and L‐NAME treatments. NI indicates nonischemic; Isch, ischemic. n=12 animals per cohort, *P<0.05 compared to PBS ischemic tissue data, #P<0.05 H2S versus H2S+inhibitor treatments.
Figure 5.
Figure 5.
H2S effects on plasma and tissue NO formation and bioavailability. A and B, H2S‐induced plasma and tissue NOx levels, respectively, in wild‐type mice at day 3 and day 10 after ligation. C and D, H2S‐mediated NOx levels in plasma and ischemic tissues of eNOS−/− mice at day 3 and day 10 after ligation. E, H2S‐mediated cGMP levels in ischemic and nonischemic tissues from wild‐type and eNOS−/− mice at day 10 after ligation. RSNO indicates nitrosothiol; WT, wild type; KO, knockout; and Isch, ischemic. n=5 animals per cohort. *P<0.05, **P<0.001 compared to PBS control data, #P<0.05 compared to eNOS−/− PBS ischemic tissue data.
Figure 6.
Figure 6.
Western blot analyses of NOS isoforms in wild‐type and eNOS−/− mice. Western blots and corresponding quantification below comparing levels of phospho‐eNOS (Ser 1177), total eNOS, iNOS, and nNOS, respectively, from the nonligated (NI) and ligated (I) gastrocnemius muscle tissues of wild‐type mice (A to D) and eNOS−/− mice (E to G), respectively. n=5 animals per genotype per time point, *P<0.05 or *P<0.001 as compared to nonligated tissues. Western blots were repeated 3 times.
Figure 7.
Figure 7.
H2S stimulates nitrite reduction to NO in hypoxic endothelial cells. A, Release of NO after administration of 50 μmol/L H2S with a chemiluminescent NO analyzer under normoxic (21% O2) and hypoxic (1% O2) conditions. B, Release of NO after administration of 50 μmol/L H2S after the addition of cPTIO or paraformaldehyde. C, Release of NO after administration of 50 μmol/L H2S after treatment of cells with sulfanilamide or febuxostat. D, Amounts of released NO after administration of different doses of H2S in the presence of paraformaldehyde (3%), NEM (10 μmol/L), sulfanilamide (1 mmol/L), febuxostat (10 nmol/L), cPTIO (200 μmol/L), or L‐NAME (300 μmol/L). E through G, Interaction between H2S and nitrite followed by amount of NO generation in the presence or absence of recombinant XO (0.0025 U, 0.005 U, and 0.01 U/mg). n=6 replicates performed in triplicate. *P<0.01 compared to PBS control data.
Figure 8.
Figure 8.
H2S effects on eNOS expression and activation in vitro. Mouse endothelial cells were cultured under normoxic or hypoxic conditions and then treated with 50 μmol/L H2S and used for NOS Western blot analysis at different time points. A and B, Phospho/total eNOS under normoxia and hypoxia with PBS or sulfide stimulation, respectively. C and D, iNOS expression under normoxia and hypoxia with PBS or sulfide stimulation, respectively. E and F, nNOS expression under normoxia and hypoxia with PBS or sulfide stimulation, respectively. G, Endothelial XO activity under normoxia and hypoxia. n=5, Western blots were repeated in triplicate, *P<0.05 0 min PBS or Normoxia versus v2S per time point. Solid line with significance indication illustrates differences between respective time points.
Figure 9.
Figure 9.
H2S increases ischemic tissue XO activity that regulates ischemic tissue reperfusion and vascular remodeling. A and B, XO activity after H2S therapy in wild‐type and eNOS−/− mice 10 days after ligation. C and D, Blood flow recovery after febuxostat in wild‐type and eNOS−/− mice in different time points. E and F, Angiogenesis index in wild‐type and eNOS−/− mice 10 days after ligation. n=5 animals, per cohort, *P<0.05 compared to PBS ischemic tissue data and #P<0.05 compared to H2S ischemic tissue data, or before and after ligation.
Figure 10.
Figure 10.
H2S stimulates hypoxic endothelial cell proliferation in a NO–HIF‐1α–dependent manner. A, Endothelial bromodeoxyuridine (BrdU) incorporation after H2S dose–dependent treatment in normoxic (21% O2) conditions. B, Endothelial BrdU incorporation after H2S dose–dependent treatment in hypoxic (1% O2) conditions. C, Effect of 50 μmol/L sodium sulfide on HIF‐1α activity under normoxic (21% O2) conditions. D, Effect of sodium sulfide on HIF‐1α activity under hypoxic (1% O2) conditions in vitro. E, Effect of NEM, cPTIO, or HIF‐1α small interfering RNA (siRNA) knockdown on H2S‐mediated hypoxic endothelial cell proliferation. n=6 replicates performed in triplicate, *P<0.05 compared to PBS, #P<0.05 compared to H2S or diethylamine NONOate (DEANO) treatment alone.
Figure 11.
Figure 11.
H2S increases HIF‐1α expression in ischemic tissues in an XO‐dependent manner. Tissues were stained with anti‐CD31 (red), anti–HIF‐1α (green), and DAPI nuclear counterstain (blue). A, CD31 and HIF‐1α staining in PBS‐treated ischemic tissue at day 10. B, CD31 and HIF‐1α staining in H2S‐treated ischemic tissue at day 10. C, CD31 and HIF‐1α staining in PBS+febuxostat treatment. D, CD31α and HIF‐1α staining in H2S+febuxostat treatments.
Figure 12.
Figure 12.
H2S increases ischemic tissue VEGF expression that regulates reperfusion. A, Tissue concentrations of VEGF in ischemic and nonischemic tissues of 0.5 mg/kg sodium sulfide–treated animals at 7 days after ligation. B, Tissue concentrations of VEGF in ischemic and nonischemic tissues of sodium sulfide–treated animals at 10 days after ligation. C, Effect of H2S+cPTIO on VEGF expression in ischemic and nonischemic tissues. D, Concentrations of VEGF protein in tissues from H2S‐treated eNOS−/− mice in the presence and absence of L‐NAME or cPTIO. E, Ischemic limb blood flow values of wild‐type animals treated with H2S+VEGF164 aptamer or denatured VEGF164 aptamer. F, Tissue VEGF levels of wild‐type animals treated with H2S+VEGF164 aptamer or denatured VEGF164 aptamer. n=12 animals per experimental cohort, *P<0.05 compared to nonischemic, or VEGF164 aptamer data; #P<0.05 ischemic limb comparison, or before and after ligation.
Figure 13.
Figure 13.
H2S restores established diabetic ischemic limb reperfusion and angiogenic activity in a VEGF‐dependent manner. A, Ischemic hind‐limb blood flow changes in 9‐month‐old diabetic mice subjected to femoral artery ligation followed by delayed 0.5 mg/kg sodium sulfide or PBS control therapy. B, Capillary‐to‐myofiber ratio change with sodium sulfide versus PBS therapy between nonischemic and ischemic gastrocnemius muscle tissue. C, Ischemic hind‐limb blood flow in diabetic animals treated with H2S+VEGF164 aptamer (25 mg/kg IM injection, twice daily) or heat‐denatured VEGF164 aptamer. D, Tissue VEGF levels in H2S‐treated diabetic animals with VEGF164 aptamer or heat‐denatured VEGF164 aptamer. E, Graphical representation of the CD31:DAPI ratio demonstrating vascular density in different gastrocnemius tissues from mice treated with H2S + denatured VEGF aptamer and H2S + VEGF aptamer. F, Graphical representation of Ki67:DAPI ratio demonstrating proliferation in different gastrocnemius tissues from mice treated with H2S + denatured VEGF aptamer and H2S + VEGF aptamer. For A, B, and C: n=8 animals per experimental cohort, *P≤0.05 compared to PBS control or VEGF164 aptamer data; #P≤0.05 ischemic limb comparison, or before and after ligation. For D, E, and F: n=8 animals per experimental cohort, *P≤0.05 compared to nonischemic limb H2S + denatured VEGF164 aptamer data; #P≤0.05 ischemic limb comparison.
Figure 14.
Figure 14.
Inhibition of K‐ATP channels on H2S‐mediated ischemic vascular remodeling. A, Effect of glibenclamide (1.4 mg/kg)–mediated K‐ATP channel inhibition on H2S‐dependent ischemic limb reperfusion. B, Effect of glibenclamide plus H2S on ischemic vascular CD31:DAPI density. n=8 animals per treatment cohort, *P<0.05 versus PBS ischemia.

Similar articles

Cited by

References

    1. Petersen LC. The effect of inhibitors on the oxygen kinetics of cytochrome c oxidase. Biochim Biophys Acta.. 1977;460:299-307. - PubMed
    1. Smith RP, Gosselin RE. Hydrogen sulfide poisoning. J Occup Med.. 1979;21:93-97. - PubMed
    1. Guidotti TL. Hydrogen sulphide. Occup Med (Lond).. 1996;46:367-371. - PubMed
    1. Tang C, Li X, Du J. Hydrogen sulfide as a new endogenous gaseous transmitter in the cardiovascular system. Curr Vasc Pharmacol.. 2006;4:17-22. - PubMed
    1. Kamoun P. Endogenous production of hydrogen sulfide in mammals. Amino Acids.. 2004;26:243-254. - PubMed

Publication types

MeSH terms

LinkOut - more resources