. 2012 Oct;1(5):e004408.
doi: 10.1161/JAHA.112.004408. Epub 2012 Oct 25.

Deleterious effect of the IL-23/IL-17A axis and γδT cells on left ventricular remodeling after myocardial infarction

Affiliations

Deleterious effect of the IL-23/IL-17A axis and γδT cells on left ventricular remodeling after myocardial infarction

Xiaoxiang Yan et al. J Am Heart Assoc. 2012 Oct.

Abstract

Background: Left ventricular (LV) remodeling leads to chronic heart failure and is a main determinant of morbidity and mortality after myocardial infarction (MI). At the present time, therapeutic options to prevent LV remodeling are limited.

Methods and results: We created a large MI by permanent ligation of the coronary artery and identified a potential link between the interleukin (IL)-23/IL-17A axis and γδT cells that affects late-stage LV remodeling after MI. Despite the finsinf that infarct size 24 hours after surgery was similar to that in wild-type mice, a deficiency in IL-23, IL-17A, or γδT cells improved survival after 7 days, limiting infarct expansion and fibrosis in noninfarcted myocardium and alleviating LV dilatation and systolic dysfunction on day 28 post-MI. M(1) macrophages and neutrophils were the major cellular source of IL-23, whereas >90% of IL-17A-producing T cells in infarcted heart were CD4(-) TCRγδ(+) (γδT) cells. Toll-like receptor signaling and IL-1β worked in concert with IL-23 to drive expansion and IL-17A production in cardiac γδT cells, whereas the sphingosine-1-phosphate receptor and CCL20/CCR6 signaling pathways mediated γδT cell recruitment into infarcted heart. IL-17A was not involved in the acute inflammatory response, but it functioned specifically in the late remodeling stages by promoting sustained infiltration of neutrophils and macrophages, stimulating macrophages to produce proinflammatory cytokines, aggravating cardiomyocyte death, and enhancing fibroblast proliferation and profibrotic gene expression.

Conclusions: The IL-23/IL-17A immune axis and γδT cells are potentially promising therapeutic targets after MI to prevent progression to end-stage dilated cardiomyopathy.

Keywords: heart failure; immune system; inflammation; myocardial infarction; remodeling.


Figures

Figure 1.
Figure 1.
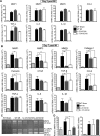
Quantification of temporal dynamics of IL-23/IL-17A axis in the infarcted heart. A, Time course of changes in mRNA expression of IL-23p19, IL-12p40, IL-23 receptor (IL-23R), RORγt, IL-17A, and IL-17 receptor A (IL-17RA) in heart tissue after MI. The levels of each transcript were normalized to 18S (n=4 to 6 each). *P<0.05, **P<0.01 vs sham. B, IL-23 protein levels were measured by ELISA in left ventricular tissues after MI. Values were normalized to total protein concentration in left ventricular tissues (n=4 each). *P<0.05 vs sham. Data in (A) and (B) were analyzed by Kruskall–Wallis tests with Dunn's multiple comparisons.
Figure 2.
Figure 2.
There were leukocytes that could produce IL-17A in response to IL-23 in the heart. The enriched leukocytes collected from either sham-operated or infarcted heart (on day 6 post-MI) were stimulated with IL-23 (10 ng/mL) for 24 hours and then analyzed for gene expressions, as indicated by quantitative RT-PCR (n=4). NS, not significant; *P<0.05, **P<0.01, #P<0.05 vs corresponding sham group. Data were analyzed by 2-way ANOVA followed by Tukey's post hoc analysis.
Figure 3.
Figure 3.
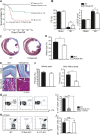
Infarct size and cardiac function were comparable among different mice. A, Twenty-four hours after MI, hearts were removed and stained with 2,3,5-triphenyltetrazolium chloride (TTC) for measurement of infarct area. Viable parts of the heart appear red and the infarct area white. B, Quantification of the infarct area shows a comparable infarct size among WT, IL-23-KO, IL-17A-KO, and TCRγδ-KO mice on day 1 after MI (n=5). C, There was no significant difference in left ventricular fractional shortening (FS) or left ventricular end diastolic diameter (LVEDD) on day 1 after MI, as evaluated by echocardiography (n=5). WT indicates wild-type; KO, knockout; LV, left ventricular; NS, not significant; and MI, myocardial infarction. Statistical analysis was performed by Kruskall–Wallis tests (B and C).
Figure 4.
Figure 4.
Deficiency of IL-23 and IL-17A conferred resistance to LV remodeling on day 28 post-MI. A, Kaplan–Meier survival analysis in WT, IL-23-KO, and IL-17A-KO mice after MI or sham operation. B, Echocardiographic analysis of fractional shortening (FS) and left ventricular end diastolic diameter (LVEDD) after MI or sham operation (n=9 to 16). C, Azan staining of cardiac sections in WT, IL-23-KO, and IL-17A-KO mice after MI. D, Infarct size determined with Azan staining of sections (n=9 to 16). E, Representative Azan-stained images of infarcted and noninfarcted areas 28 days after MI. Blue staining indicates fibrosis. Scale bars indicate 50 μm. F, Quantification of fibrotic area in infarcted and noninfarcted areas 28 days after MI in WT (n=10), IL-23-KO (n=9), and IL-17A-KO (n=11) mice. Statistical analysis was performed using 2-way ANOVA followed by Tukey's post hoc analysis (B) or Kruskall–Wallis tests with Dunn's multiple comparisons (D and F). LV indicates left ventricular; MI, myocardial infarction; WT, wild-type; and KO, knockout. *P<0.05, **P<0.01 vs WT heart.
Figure 5.
Figure 5.
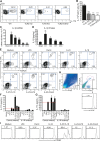
Major cellular sources of IL-23 and IL-17A. A, IL-23p19 mRNA expression in each cell population prepared from heart on day 1 post-MI (n=3). Other, CD11b cells; M1, M1 macrophage; M2, M2 macrophage. B, Intracellular cytokine and surface marker staining was performed on the enriched leukocytes prepared from heart on day 7 post-MI. Data are representative of 4 independent experiments. C, Comparison of IL-17A-producing and IFN-γ-producing cells in infiltrated T lymphocytes from infarcted heart on day 7 post-MI between WT and KO mice. Data are representative of 4 independent experiments. WT indicates wild-type; KO, knockout; MI, myocardial infarction; and NS, not significant; ***P<0.001 vs WT heart. D through G, IL-17A+ T-cell populations prepared from heart (D and F) and spleen (E and G) on day 7 post-MI were further analyzed for TCRγδ and CD4 expression by flow cytometry (n=4 each). ***P<0.001. H, Time course of change in numbers of infiltrating IL-17A+ cells in the infarcted heart (n=4 to 6 each). **P<0.01 vs sham heart. I, Quantities represent absolute number of γδT cells per heart (n=4 to 6 each). **P<0.01 vs sham. J, α-Actinin (green fluorescence, upper panel) and TCRγδ (middle and bottom panels) immunostaining of heart tissue on day 7 post-MI. K, Number of γδT cells in infarct, border, and noninfarct areas (n=5). **P<0.01 vs noninfarct area. Scale bar, 20 μm. Data in (F) and (G) were analyzed by Mann–Whitney U tests; data in (C), (H), (I), and (K) were analyzed by Kruskall–Wallis tests with Dunn's multiple comparisons.
Figure 6.
Figure 6.
The cellular source of IFN-γ. A, Intracellular cytokine staining combined with surface markers was performed on the enriched leukocytes prepared from heart on day 7 post-MI. Data are representative of 4 independent experiments. IFN-γ+ T-cell populations prepared from heart (B and D) and spleen (C and E) on day 7 post-MI were further analyzed for TCRγδ and CD4 levels by flow cytometry (n=4). MI indicates myocardial infarction. ***P<0.001. Data in (D) and (E) were analyzed by Mann–Whitney U tests.
Figure 7.
Figure 7.
Comparison of immune cells infiltrated into infarcted heart among WT, IL-23-KO, and IL-17A-KO mice. A, Flow-cytometric analysis of infiltrating immune cell numbers in infarcted heart on day 7 post-MI between WT and KO mice (n=4 to 6 each). WT indicates wild-type; KO, knockout; and MI, myocardial infarction. *P<0.05, **P<0.01 vs WT MI. B, Percentage of γδT cells among T cells in infarcted heart on day 7 post-MI in WT and KO mice (n=4 to 6 each). **P<0.01 vs WT MI. Data in (A) and (B) were analyzed by Kruskall–Wallis tests with Dunn's multiple comparisons.
Figure 8.
Figure 8.
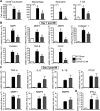
Comparison of fibrosis-related genes and inflammatory mediator expression in infarcted hearts of WT, IL-23-KO, and IL-17A-KO mice. A, Relative changes in levels of mRNA encoding MMPs, fibrosis-related genes, and proinflammatory cytokines measured by quantitative RT-PCR in heart tissue on day 2 post-MI (n=4 each). *P<0.05 vs WT MI. B, Relative changes in levels of mRNA encoding MMPs, fibrosis-related genes, and proinflammatory cytokines in heart tissue on day 7 post-MI (n=4 each). *P<0.05, **P<0.01 vs WT MI. C, Representative photograph of zymographic gel demonstrating MMP9 and MMP2 activities in heart tissues of WT and KO mice on day 7 after MI. D, Quantitative analysis of MMP9 and MMP2 activities after MI based on gelatin zymography. Data were obtained from 3 independent experiments. *P<0.05, **P<0.01 vs WT MI. MMP indicates matrix metalloproteinases; WT, wild-type; KO, knockout; and MI, myocardial infarction. Data in (A), (B), and (D) were analyzed by Kruskall–Wallis tests with Dunn's multiple comparisons.
Figure 9.
Figure 9.
Deficiency in TCRγδ conferred resistance to LV remodeling on day 28 post-MI. Kaplan–Meier survival analysis (A) and echocardiographic analysis (B) in WT and TCRγδ-KO mice (n=10 to 16 each). *P<0.05, **P<0.01 vs WT MI (2-way ANOVA followed by Tukey's post hoc analysis). C, Azan staining of cardiac sections in WT and TCRγδ-KO mice after MI. D, Infarct size determined by Azan staining of sections (n=10 to 16). *P<0.05 vs WT MI. E, Representative Azan-stained images of infarcted and noninfarcted areas 28 days after MI; blue staining indicates fibrosis. Scale bars indicate 50 μm. F, Quantification of fibrotic area in infarcted and noninfarcted areas 28 days after MI in WT (n=10) and TCRγδ-KO (n=9) mice. **P<0.01 vs WT heart. Data in (D) and (F) were analyzed by Mann–Whitney U tests. G through J, Comparison of IL-17A-producing T cells (G and I) and γδT cells (H and J) in infiltrating T lymphocytes in infarcted heart on day 7 post-MI between WT and KO mice (n=4 each). WT indicates wild-type; KO, knockout; MI, myocardial infarction; and LV, left ventricular. ***P<0.001 vs WT MI (Kruskall–Wallis tests with Dunn's multiple comparisons).
Figure 10.
Figure 10.
Effect of γδT cell deficiency on immune cell infiltration and inflammatory mediator expression. A, Flow-cytometric analysis of infiltrating immune cells in the heart on day 7 post-MI between WT and KO mice (n=4 each). *P<0.05 vs WT sham; #P<0.05 vs WT MI. B, Relative changes in levels of mRNA encoding MMPs, fibrosis-related genes, and chemokines in heart tissue on day 7 post-MI (n=4 each). *P<0.05 vs WT sham; #P<0.05 vs WT MI. C, mRNA levels of indicated genes were measured by quantitative RT-PCR in heart tissue on day 2 post-MI (n=4 each). D, IFN-γ mRNA levels were measured by quantitative RT-PCR in heart tissue on day 7 post-MI (n=4 each). MMP indicates matrix metalloproteinases; WT, wild-type; KO, knockout; and MI, myocardial infarction. Data in (A), (B), (C), and (D) were analyzed by Kruskall–Wallis tests with Dunn's multiple comparisons.
Figure 11.
Figure 11.
Sphingosine 1-phosphate (S1P) signaling and the CCL20/CCR6 axis mediate γδT cell recruitment into the heart. A through C, FTY720 or H2O was administered before MI and every 24 hours thereafter. A, Representative figures revealed that proportions of the lymphocyte (CD45+CD11b) and γδT-cell (CD45+CD11bTCRγδ+) infiltration into the heart were suppressed by FTY720 on day 6 after MI. B and C, Absolute number of heart-infiltrating inflammatory cells (B) and percentage of γδT cells among total T cells (C) were quantified on day 6 after MI (n=6 for H2O group and n=4 for FTY720 group). *P<0.05, **P<0.01 vs H2O group. Data in (B) and (C) were analyzed by Mann–Whitney U tests. D, CCR6 expression in splenic and cardiac γδT cells on day 7 after MI. Gray histogram indicates isoform controls. Data are representative of 3 experiments. E, Time course of changes in mRNA expression of CCL20 in post-MI heart. Values were normalized to 18S (n=4 to 6 each). MI indicates myocardial infarction. **P<0.01 vs sham (Kruskall–Wallis tests with Dunn's multiple comparisons).
Figure 12.
Figure 12.
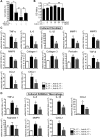
TLR signaling and IL-1β are involved in IL-23-induced IL-17A production from γδT cells. A, Comparison of IL-17A-producing infiltrating T lymphocytes isolated from infarcted hearts on day 7 post-MI among WT, TLR2-KO, TLR4-KO, and TLR2/4-DKO mice. Data are representative of 4 independent experiments. B, Percentage of IL-17A+ cells among total T cells in the heart was quantified on day 7 after MI (n=4 to 7). **P<0.001 vs WT heart. C, Time course of changes in mRNA expression of IL-1β in heart tissue after MI. Values were normalized to 18S (n=4 to 6 each). **P<0.01 vs sham. D, IL-1β protein levels were measured by ELISA in left ventricular tissue after MI. Values were normalized to total protein concentration in left ventricular tissue (n=4 each). *P<0.05, **P<0.01 vs sham. E, Cardiac cells prepared from day 7 post-MI hearts were stimulated with IL-23, IL-1β, LPS, Pam3CSK4 (Pam3) alone, or IL-23 plus IL-1β and different pathogenic products for 3 days. Intracellular IL-17A production was determined by flow cytometry, gated on CD3+ T cells. Data are representative of 3 independent experiments. F and G, Cardiac total cells (F) and CD45+ cells (G) sorted from day 7 post-MI hearts were stimulated with the indicated cytokines and/or pathogenic products for 3 days either in the presence or the absence of IL-1RI antibody. Supernatants were then harvested and measured for IL-17A by ELISA (n=4 for each group). H and I, Cardiac cell suspensions prepared from day 7 post-MI heart were labeled with CFSE and then stimulated with the indicated cytokines and/or pathogenic products for 3 days. Cells were harvested and stained with anti-CD3 and anti-TCRγδ antibodies. Cells were gated on γδT cells for flow cytometry. Representative gating strategy for γδT cell proliferation assay (H) and CFSE dilution assay (I) is shown. WT indicates wild-type; Data are representative of 3 independent experiments. Data in (B), (C), and (D) were analyzed by Kruskall–Wallis tests with Dunn's multiple comparisons.
Figure 13.
Figure 13.
In vivo cell-specific function of IL-17RA in the infarcted heart. A, Single-cell suspensions isolated from heart on day 7 post-MI were sorted by flow cytometry. Macrophages (Mac): CD45+F4/80+; lymphocytes (Lym): CD45+F4/80; fibroblasts (Fibro): CD45Thy-1+CD31; endothelial cells (EC): CD45CD31+Thy-1. B, IL-17RA expression in each fraction (n=3). C, Apoptotic cardiomyocytes were detected by TUNEL staining combined with α-actinin staining in the border zone on day 2 and day 7 after MI in WT and IL-17A-KO mice (n=6 each). NS indicates not significant; WT, wild-type; MI, myocardial infarction; MMP, matrix metalloproteinases; and KO, knockout. *P<0.05 (2-way ANOVA followed by Tukey's post hoc analysis). D, mRNA levels of indicated genes in sorted fibroblasts (n=5). *P<0.05 vs WT. E, mRNA levels of indicated genes in sorted macrophages (n=5 each). *P<0.05 vs WT. F, CXCR2 expression in splenic and cardiac neutrophils on day 7 after MI. Gray histogram indicates isoform controls. Data are representative of 3 experiments. Data in (D) and (E) were analyzed by Mann–Whitney U tests.
Figure 14.
Figure 14.
Effect of IL-17A on cultured cardiomyocytes, fibroblasts and RAW264.7 macrophages. A, Neonatal mouse cardiomyocytes were pretreated with neutralizing anti-IL-17A antibody (1 μg/mL) followed by hypoxia and then IL-17A (100 ng/mL) stimulation. Dead cells and viable cells were determined as described in Methods. Viable cells were quantified by counting 100 cells in 5 independent experiments (n=5). **P<0.01, #P<0.05, and &P<0.05. B, Neonatal mouse fibroblasts were stimulated with IL-17A at the indicated concentrations for 72 hours in the presence or absence of neutralizing anti-IL-17A antibody, and cell proliferation was measured with a cell counting kit-8 (n=6 each). **P<0.01 vs vehicle-treated cells, ##P<0.01 vs anti-IL-17A antibody–untreated cells. C, Neonatal mouse fibroblasts were stimulated with IL-17A (100 ng/mL) for 24 hours in the presence or absence of neutralizing anti-IL-17A antibody (1 μg/mL), and mRNA levels of indicated genes were measured by real-time PCR (n=5 each). *P<0.05 vs vehicle-treated cells, #P<0.05 vs anti-IL-17A antibody–untreated cells. D, RAW264.7 macrophages were stimulated with IL-17A (100 ng/mL) for 24 hours in the presence or absence of neutralizing anti-IL-17A antibody (1 μg/mL), and mRNA levels of indicated genes were measured by real-time PCR (n=5 each). *P<0.05 vs vehicle-treated cells, #P<0.05 vs anti-IL-17A antibody–untreated cells. MMP indicates matrix metalloproteinases. Data in (A), (B), (C), and (D) were analyzed by Kruskall–Wallis tests with Dunn's multiple comparisons.
Figure 15.
Figure 15.
Mechanism of signal convergence on cardiac γδT cells for recruitment into infarcted heart and production of IL-17A. Damaged cells release DAMPs, which are recognized by TLRs. The subsequent TLR signaling promotes nuclear translocation of NF-κB, leading to expression of cytokines including pro-IL-1β and IL-23, which are indispensable for IL-17A production in γδT cells. Inflammasome activation leads to processing of caspase-1 into its enzymatically active form. Caspase-1 in turn cleaves pro-IL-1β, releasing active IL-1β, which can work in concert with IL-23 to drive IL-17A production in γδT cells, which also directly respond to TLR stimulation in synergy with IL-23. FTY720-sensitive S1P receptor signaling helps to mediate γδT-cell egress from lymph nodes, and CCR6-expressing γδT cells are recruited to the sites of injury that express CCL20. DAMPs indicates Danger associated molecular patterns; TLR, toll-like receptor.

References

    1. Roger VL, Go AS, Lloyd-Jones DM, Benjamin EJ, Berry JD, Borden WB, Bravata DM, Dai S, Ford ES, Fox CS, Fullerton HJ, Gillespie C, Hailpern SM, Heit JA, Howard VJ, Kissela BM, Kittner SJ, Lackland DT, Lichtman JH, Lisabeth LD, Makuc DM, Marcus GM, Marelli A, Matchar DB, Moy CS, Mozaffarian D, Mussolino ME, Nichol G, Paynter NP, Soliman EZ, Sorlie PD, Sotoodehnia N, Turan TN, Virani SS, Wong ND, Woo D, Turner MB. Heart disease and stroke statistics–2012 update: a report from the American Heart Association. Circulation. 2012;125:e2-e220. - PMC - PubMed
    1. Opie LH, Commerford PJ, Gersh BJ, Pfeffer MA. Controversies in ventricular remodelling. Lancet. 2006;367:356-367. - PubMed
    1. Krum H, Teerlink JR. Medical therapy for chronic heart failure. Lancet. 2011;378:713-721. - PubMed
    1. Mudd JO, Kass DA. Tackling heart failure in the twenty-first century. Nature. 2008;451:919-928. - PubMed
    1. Brown NJ, Vaughan DE. Angiotensin-converting enzyme inhibitors. Circulation. 1998;97:1411-1420. - PubMed

Publication types