

A pilot evaluation of on-road detection performance by drivers with hemianopia using oblique peripheral prisms
- PMID: 23316415
- PMCID: PMC3539405
- DOI: 10.1155/2012/176806
A pilot evaluation of on-road detection performance by drivers with hemianopia using oblique peripheral prisms
Abstract
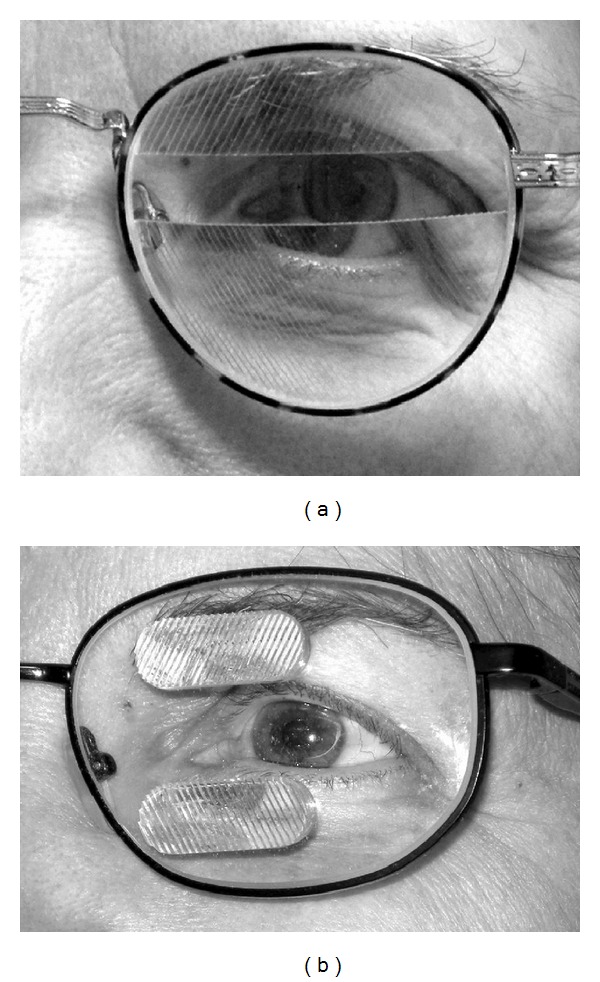
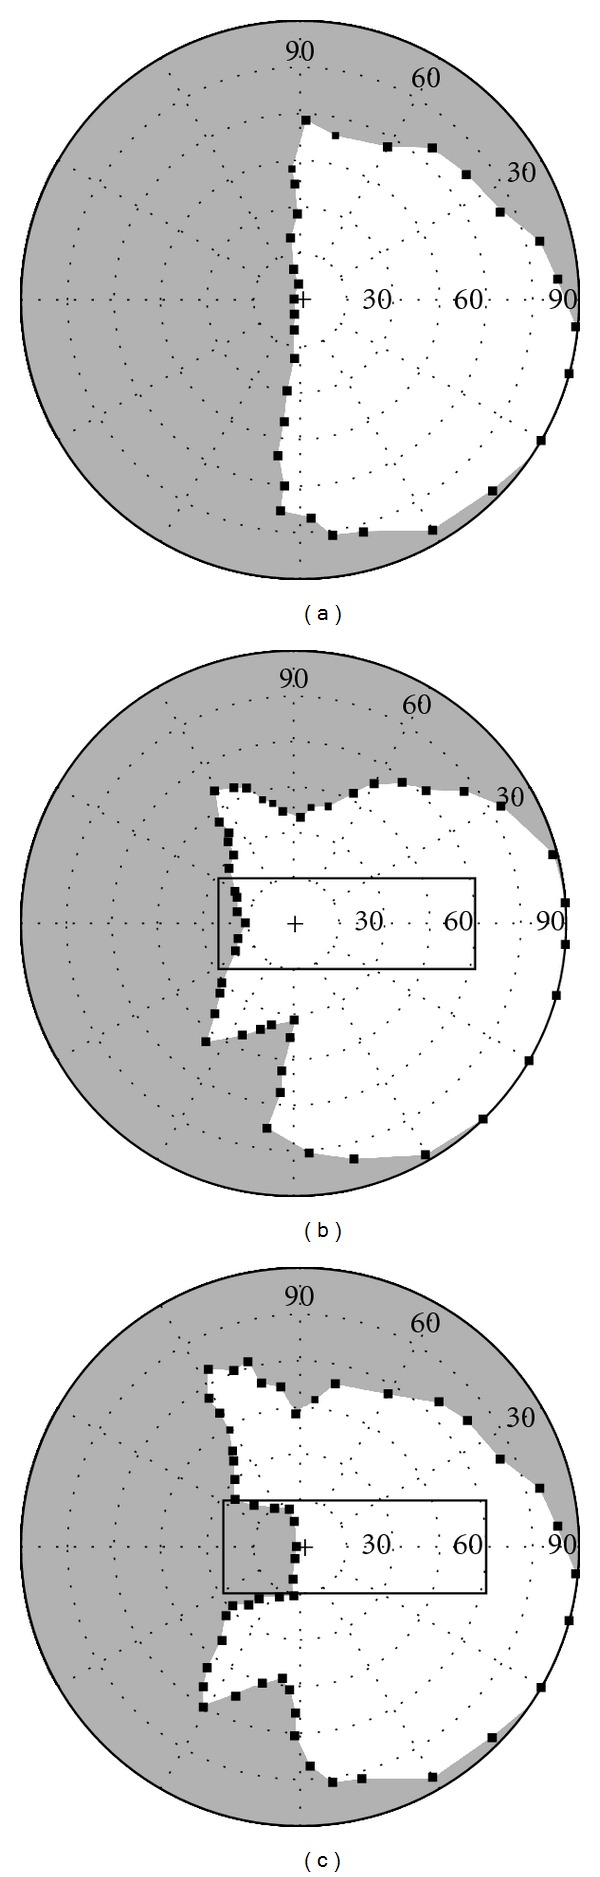
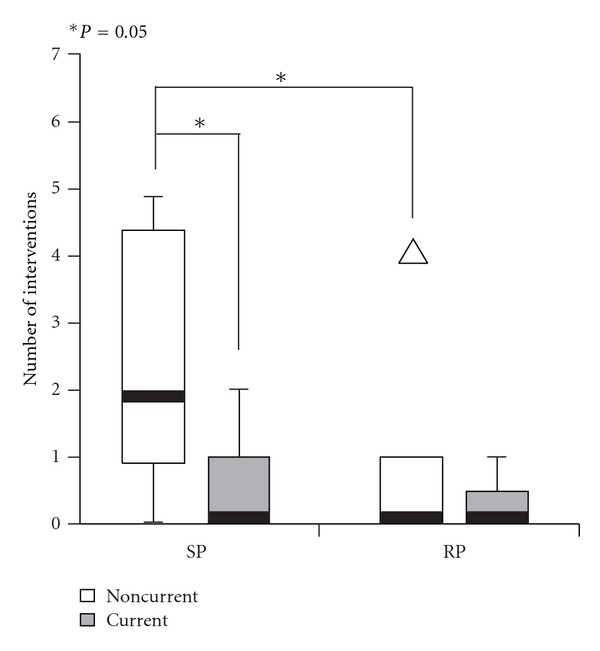
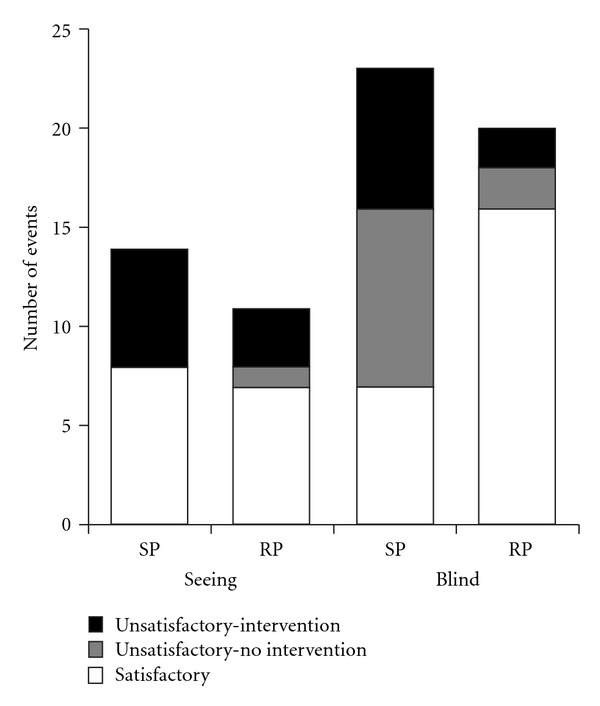
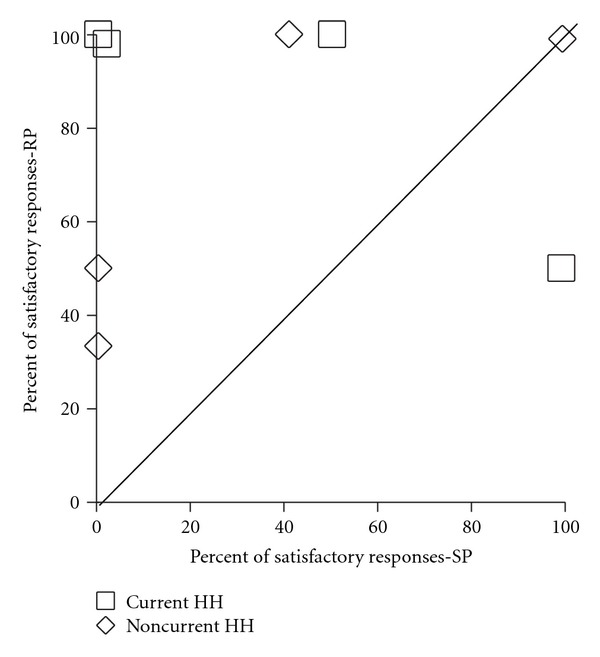
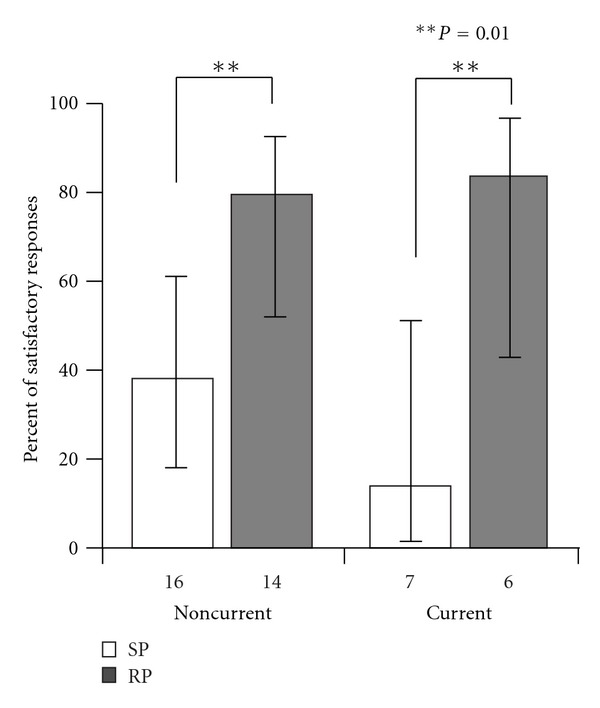
Aims. Homonymous hemianopia (HH), a severe visual consequence of stroke, causes difficulties in detecting obstacles on the nonseeing (blind) side. We conducted a pilot study to evaluate the effects of oblique peripheral prisms, a novel development in optical treatments for HH, on detection of unexpected hazards when driving. Methods. Twelve people with complete HH (median 49 years, range 29-68) completed road tests with sham oblique prism glasses (SP) and real oblique prism glasses (RP). A masked evaluator rated driving performance along the 25 km routes on busy streets in Ghent, Belgium. Results. The proportion of satisfactory responses to unexpected hazards on the blind side was higher in the RP than the SP drive (80% versus 30%; P = 0.001), but similar for unexpected hazards on the seeing side. Conclusions. These pilot data suggest that oblique peripheral prisms may improve responses of people with HH to blindside hazards when driving and provide the basis for a future, larger-sample clinical trial. Testing responses to unexpected hazards in areas of heavy vehicle and pedestrian traffic appears promising as a real-world outcome measure for future evaluations of HH rehabilitation interventions aimed at improving detection when driving.
Figures
Similar articles
-
Driving With Hemianopia VI: Peripheral Prisms and Perceptual-Motor Training Improve Detection in a Driving Simulator.Transl Vis Sci Technol. 2018 Jan 18;7(1):5. doi: 10.1167/tvst.7.1.5. eCollection 2018 Jan. Transl Vis Sci Technol. 2018. PMID: 29359111 Free PMC article.
-
Randomized crossover clinical trial of real and sham peripheral prism glasses for hemianopia.JAMA Ophthalmol. 2014 Feb;132(2):214-22. doi: 10.1001/jamaophthalmol.2013.5636. JAMA Ophthalmol. 2014. PMID: 24201760 Free PMC article. Clinical Trial.
-
Pilot study of a pedestrian collision detection test for a multisite trial of field expansion devices for hemianopia.Optom Vis Sci. 2024 Jun 1;101(6):408-416. doi: 10.1097/OPX.0000000000002152. Optom Vis Sci. 2024. PMID: 38990239 Free PMC article.
-
Driving with homonymous visual field loss: a review of the literature.Clin Exp Optom. 2016 Sep;99(5):402-18. doi: 10.1111/cxo.12425. Epub 2016 Aug 17. Clin Exp Optom. 2016. PMID: 27535208 Free PMC article. Review.
-
Homonymous hemianopia: challenges and solutions.Clin Ophthalmol. 2014 Sep 22;8:1919-27. doi: 10.2147/OPTH.S59452. eCollection 2014. Clin Ophthalmol. 2014. PMID: 25284978 Free PMC article. Review.
Cited by
-
Driving with Hemianopia V: Do Individuals with Hemianopia Spontaneously Adapt Their Gaze Scanning to Differing Hazard Detection Demands?Transl Vis Sci Technol. 2017 Oct 23;6(5):11. doi: 10.1167/tvst.6.5.11. eCollection 2017 Sep. Transl Vis Sci Technol. 2017. PMID: 29067219 Free PMC article.
-
Central visual field loss and driving--reply.JAMA Ophthalmol. 2013 Jun;131(6):819-21. doi: 10.1001/jamaophthalmol.2013.4259. JAMA Ophthalmol. 2013. PMID: 23764712 Free PMC article. No abstract available.
-
A Pilot Study of Perceptual-Motor Training for Peripheral Prisms.Transl Vis Sci Technol. 2016 Feb 22;5(1):9. doi: 10.1167/tvst.5.1.9. eCollection 2016 Feb. Transl Vis Sci Technol. 2016. PMID: 26933522 Free PMC article.
-
Comments about outcome measures for clinical trials of interventions for post-stroke patients with hemianopia.Acta Neurol Scand. 2017 Nov;136(5):548-550. doi: 10.1111/ane.12770. Acta Neurol Scand. 2017. PMID: 28980309 Free PMC article. No abstract available.
-
High-Power Prismatic Devices for Oblique Peripheral Prisms.Optom Vis Sci. 2016 May;93(5):521-33. doi: 10.1097/OPX.0000000000000820. Optom Vis Sci. 2016. PMID: 26866438 Free PMC article.
References
-
- Ragland DR, Satariano WA, MacLeod KE. Driving cessation and increased depressive symptoms. The Journals of Gerontology A. 2005;60(3):399–403. - PubMed
-
- Marottoli RA, Mendes de Leon CF, Glass TA, Williams CS, Cooney LM, Berkman LF. Consequences of driving cessation: decreased out-of-home activity levels. The Journals of Gerontology B. 2000;55(6):S334–340. - PubMed
-
- Akinwuntan AE, Wachtel J, Rosen PN. Driving simulation for evaluation and rehabilitation of driving after stroke. Journal of Stroke & Cerebrovascular Diseases. 2012;21(6):478–486. - PubMed
-
- Marshall SC, Molnar F, Man-Son-Hing M, et al. Predictors of driving ability following stroke: a systematic review. Topics in Stroke Rehabilitation. 2007;14(1):98–114. - PubMed
-
- Ponsford AS, Viitanen M, Lundberg C, Johansson K. Assessment of driving after stroke—a pluridisciplinary task. Accident Analysis and Prevention. 2008;40(2):452–460. - PubMed
Grants and funding
LinkOut - more resources
Full Text Sources
