

A hybrid genetic linkage map of two ecologically and morphologically divergent Midas cichlid fishes (Amphilophus spp.) obtained by massively parallel DNA sequencing (ddRADSeq)
- PMID: 23316439
- PMCID: PMC3538344
- DOI: 10.1534/g3.112.003897
A hybrid genetic linkage map of two ecologically and morphologically divergent Midas cichlid fishes (Amphilophus spp.) obtained by massively parallel DNA sequencing (ddRADSeq)
Abstract
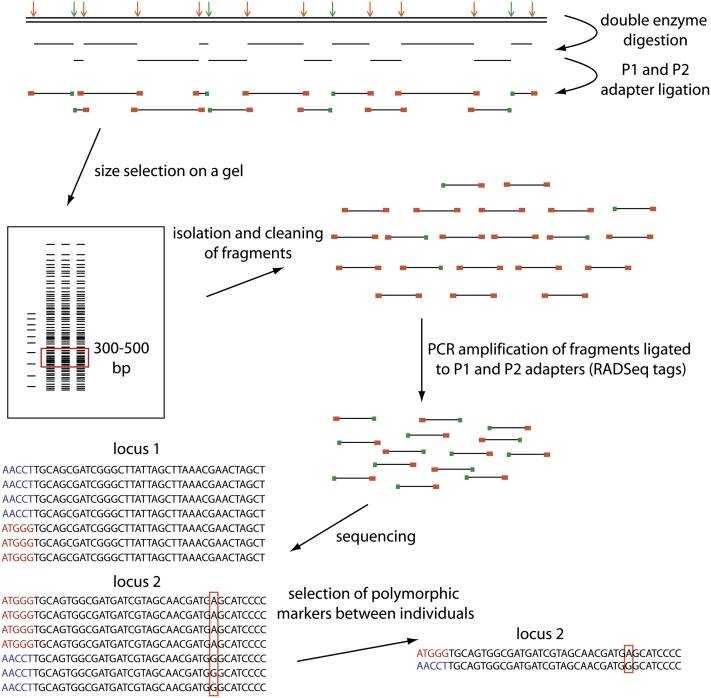
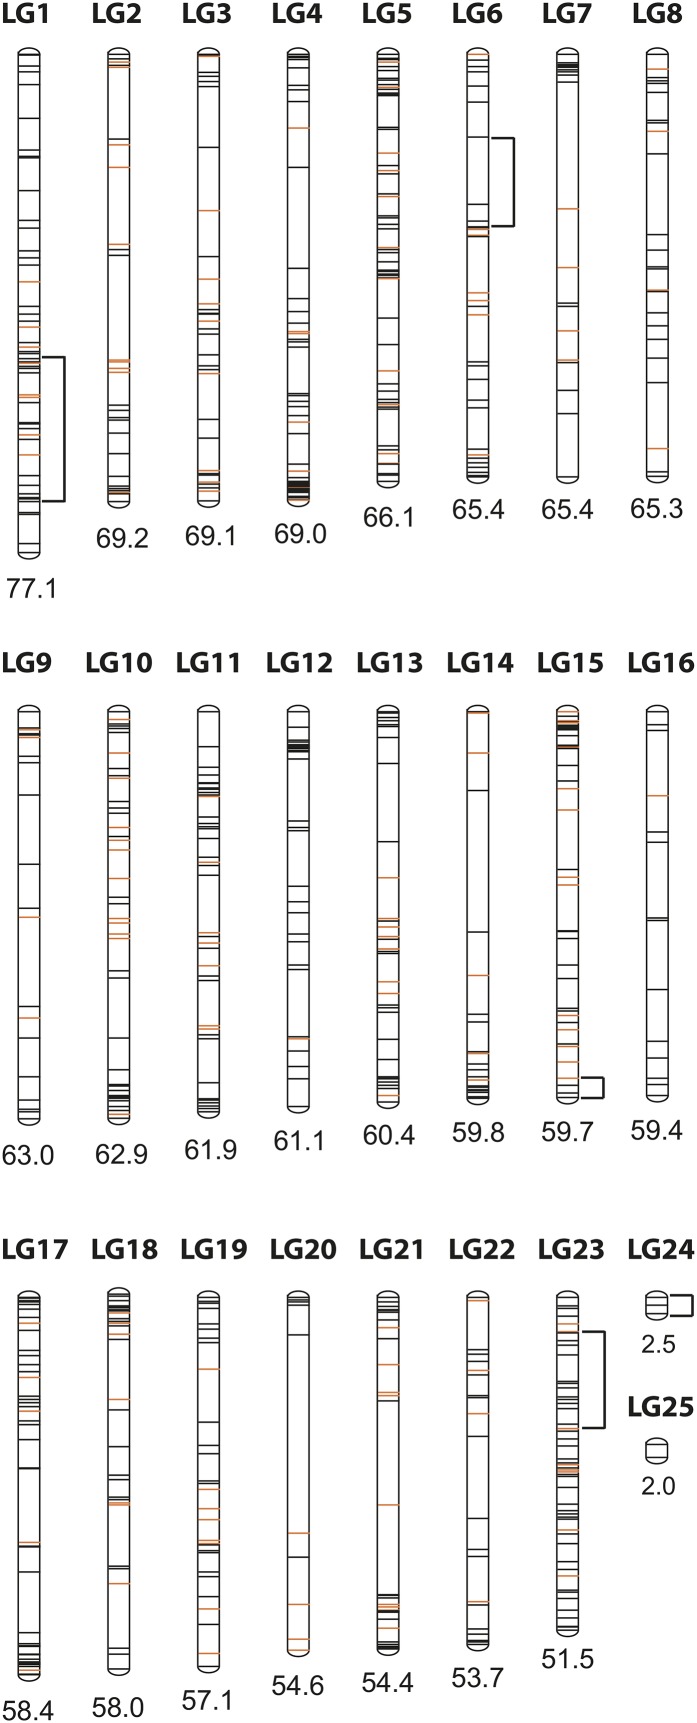
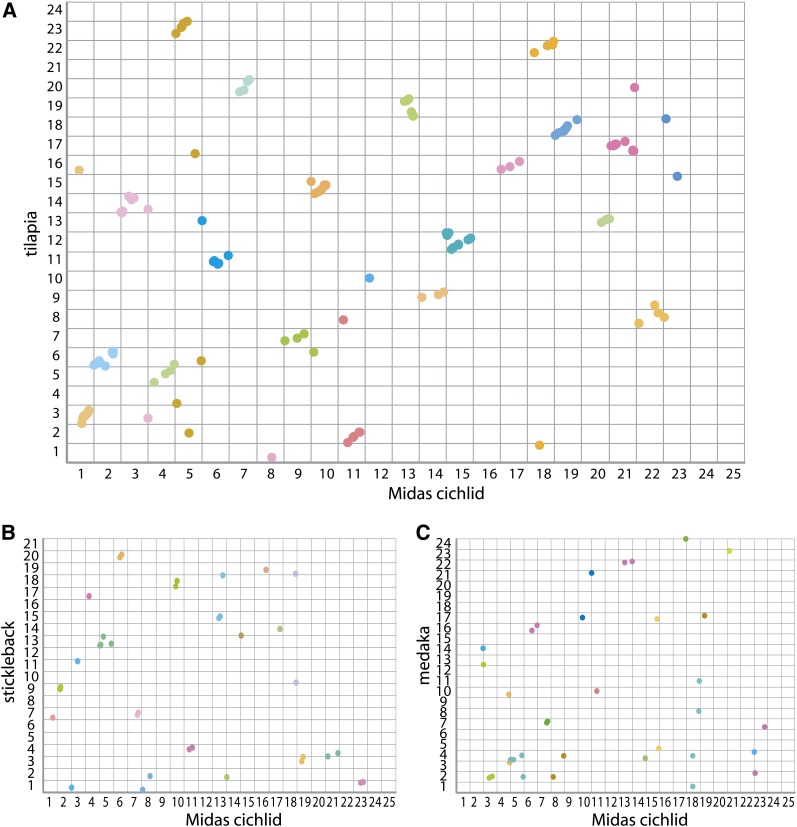
Cichlid fishes are an excellent model system for studying speciation and the formation of adaptive radiations because of their tremendous species richness and astonishing phenotypic diversity. Most research has focused on African rift lake fishes, although Neotropical cichlid species display much variability as well. Almost one dozen species of the Midas cichlid species complex (Amphilophus spp.) have been described so far and have formed repeated adaptive radiations in several Nicaraguan crater lakes. Here we apply double-digest restriction-site associated DNA sequencing to obtain a high-density linkage map of an interspecific cross between the benthic Amphilophus astorquii and the limnetic Amphilophus zaliosus, which are sympatric species endemic to Crater Lake Apoyo, Nicaragua. A total of 755 RAD markers were genotyped in 343 F(2) hybrids. The map resolved 25 linkage groups and spans a total distance of 1427 cM with an average marker spacing distance of 1.95 cM, almost matching the total number of chromosomes (n = 24) in these species. Regions of segregation distortion were identified in five linkage groups. Based on the pedigree of parents to F(2) offspring, we calculated a genome-wide mutation rate of 6.6 × 10(-8) mutations per nucleotide per generation. This genetic map will facilitate the mapping of ecomorphologically relevant adaptive traits in the repeated phenotypes that evolved within the Midas cichlid lineage and, as the first linkage map of a Neotropical cichlid, facilitate comparative genomic analyses between African cichlids, Neotropical cichlids and other teleost fishes.
Keywords: Midas cichlid; RAD markers; double-digest RADSeq; mutation rate; segregation distortion; synteny.
Figures
Similar articles
-
Genomic architecture of ecologically divergent body shape in a pair of sympatric crater lake cichlid fishes.Mol Ecol. 2014 Apr;23(7):1828-45. doi: 10.1111/mec.12590. Epub 2013 Dec 16. Mol Ecol. 2014. PMID: 24237636
-
Genomic signatures of divergent selection and speciation patterns in a 'natural experiment', the young parallel radiations of Nicaraguan crater lake cichlid fishes.Mol Ecol. 2012 Oct;21(19):4770-86. doi: 10.1111/j.1365-294X.2012.05738.x. Epub 2012 Aug 30. Mol Ecol. 2012. PMID: 22934802
-
Rapid evolution and selection inferred from the transcriptomes of sympatric crater lake cichlid fishes.Mol Ecol. 2010 Mar;19 Suppl 1:197-211. doi: 10.1111/j.1365-294X.2009.04488.x. Mol Ecol. 2010. PMID: 20331780
-
Local variation and parallel evolution: morphological and genetic diversity across a species complex of neotropical crater lake cichlid fishes.Philos Trans R Soc Lond B Biol Sci. 2010 Jun 12;365(1547):1763-82. doi: 10.1098/rstb.2009.0271. Philos Trans R Soc Lond B Biol Sci. 2010. PMID: 20439280 Free PMC article. Review.
-
Genomics of adaptation and speciation in cichlid fishes: recent advances and analyses in African and Neotropical lineages.Philos Trans R Soc Lond B Biol Sci. 2012 Feb 5;367(1587):385-94. doi: 10.1098/rstb.2011.0247. Philos Trans R Soc Lond B Biol Sci. 2012. PMID: 22201168 Free PMC article. Review.
Cited by
-
Construction of a high density SNP linkage map of kelp (Saccharina japonica) by sequencing Taq I site associated DNA and mapping of a sex determining locus.BMC Genomics. 2015 Mar 15;16(1):189. doi: 10.1186/s12864-015-1371-1. BMC Genomics. 2015. PMID: 25887315 Free PMC article.
-
Crater Lake Apoyo revisited--population genetics of an emerging species flock.PLoS One. 2013 Sep 23;8(9):e74901. doi: 10.1371/journal.pone.0074901. eCollection 2013. PLoS One. 2013. PMID: 24086393 Free PMC article.
-
Linkage maps of the Atlantic salmon (Salmo salar) genome derived from RAD sequencing.BMC Genomics. 2014 Feb 27;15:166. doi: 10.1186/1471-2164-15-166. BMC Genomics. 2014. PMID: 24571138 Free PMC article.
-
Embryonic and larval development in the Midas cichlid fish species flock (Amphilophus spp.): a new evo-devo model for the investigation of adaptive novelties and species differences.BMC Dev Biol. 2015 Feb 26;15:12. doi: 10.1186/s12861-015-0061-1. BMC Dev Biol. 2015. PMID: 25887993 Free PMC article.
-
Gene-centromere mapping in meiotic gynogenetic European seabass.BMC Genomics. 2017 Jun 7;18(1):449. doi: 10.1186/s12864-017-3826-z. BMC Genomics. 2017. PMID: 28592235 Free PMC article.
References
-
- Albertson R. C., Kocher T. D., 2006. Genetic and developmental basis of cichlid trophic diversity. Heredity 97: 211–221 - PubMed
Publication types
MeSH terms
Substances
Grants and funding
LinkOut - more resources
Full Text Sources
Other Literature Sources
Miscellaneous