
Biogeography of the ecosystems of the healthy human body

Yanjiao Zhou et al. Genome Biol. .

Abstract

Background: Characterizing the biogeography of the microbiome of healthy humans is essential for understanding microbial associated diseases. Previous studies mainly focused on a single body habitat from a limited set of subjects. Here, we analyzed one of the largest microbiome datasets to date and generated a biogeographical map that annotates the biodiversity, spatial relationships, and temporal stability of 22 habitats from 279 healthy humans.

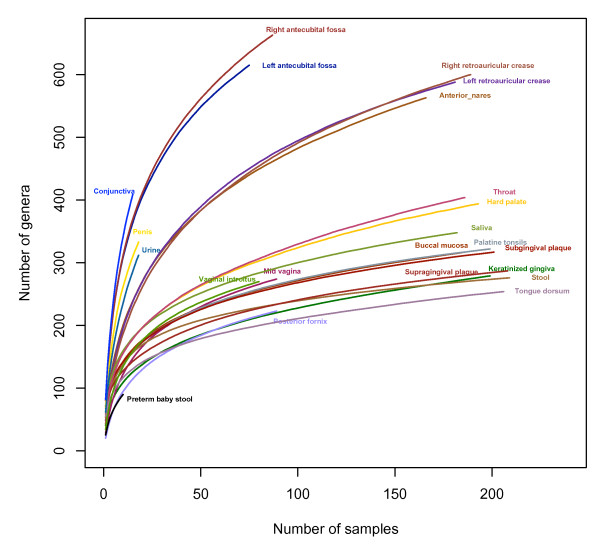
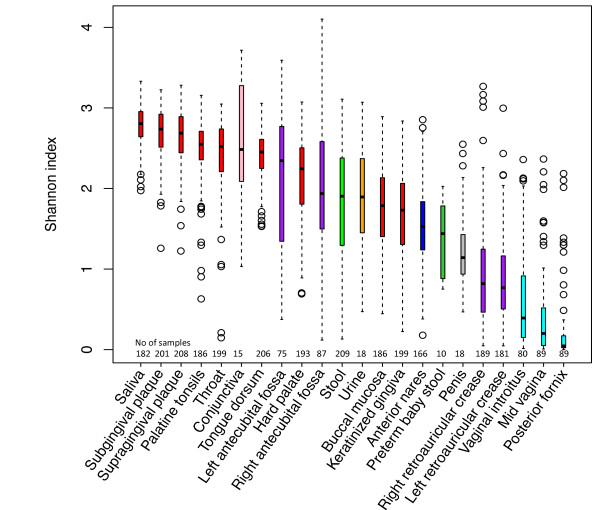
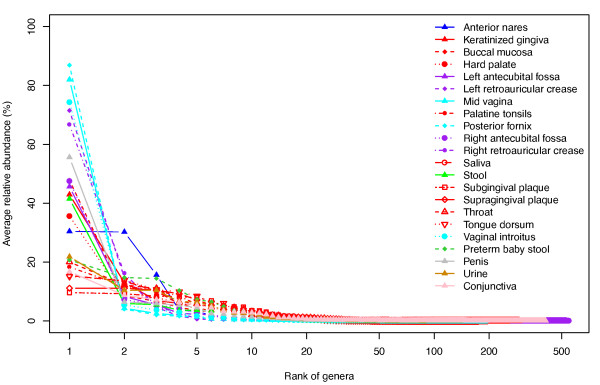
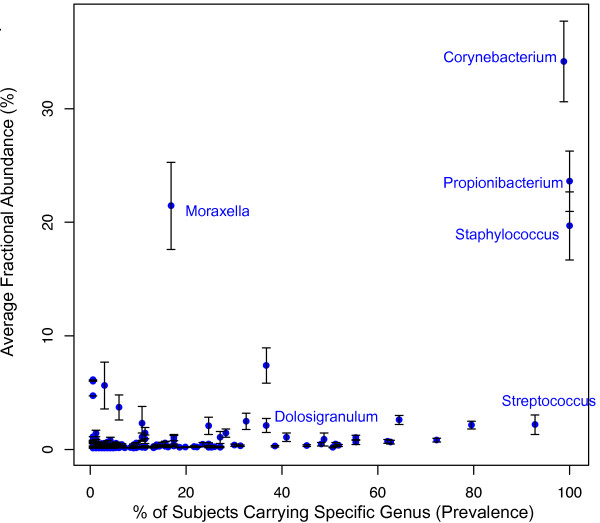
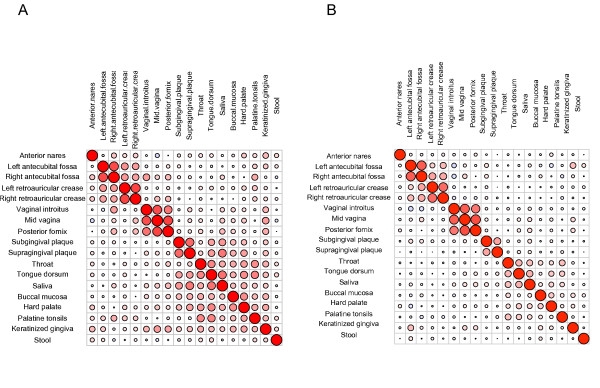
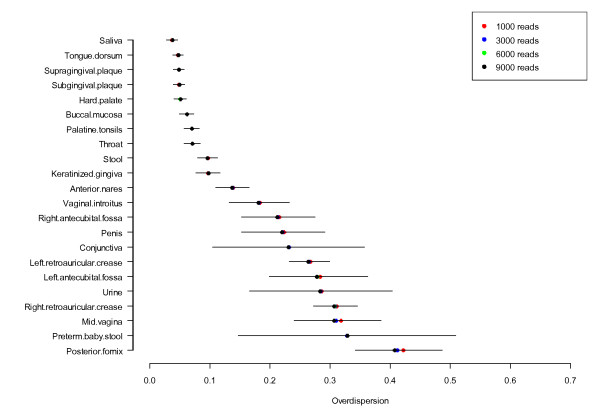
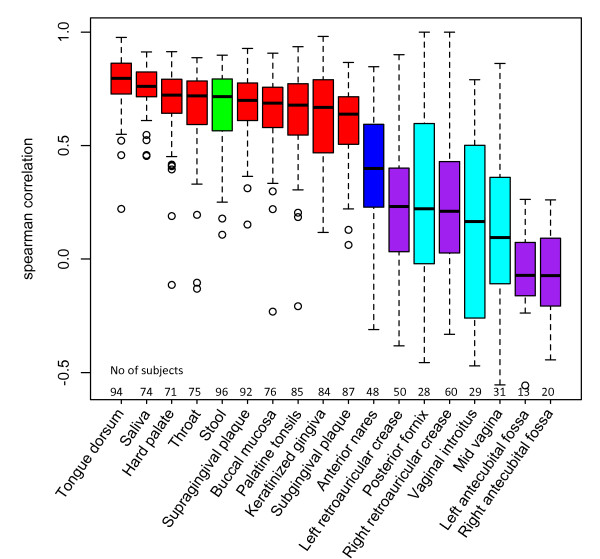
Results: We identified 929 genera from more than 24 million 16S rRNA gene sequences of 22 habitats, and we provide a baseline of inter-subject variation for healthy adults. The oral habitat has the most stable microbiota with the highest alpha diversity, while the skin and vaginal microbiota are less stable and show lower alpha diversity. The level of biodiversity in one habitat is independent of the biodiversity of other habitats in the same individual. The abundances of a given genus at a body site in which it dominates do not correlate with the abundances at body sites where it is not dominant. Additionally, we observed the human microbiota exhibit both cosmopolitan and endemic features. Finally, comparing datasets of different projects revealed a project-based clustering pattern, emphasizing the significance of standardization of metagenomic studies.

Conclusions: The data presented here extend the definition of the human microbiome by providing a more complete and accurate picture of human microbiome biogeography, addressing questions best answered by a large dataset of subjects and body sites that are deeply sampled by sequencing.


Figures

Figure 1
Figure 1
Accumulation curves of 22 habitats. Each line represents the accumulative richness from all subjects. All the reads were included in the analysis to have a full view of the genera revealed by the HMP and other datasets. At the genus level, oral, vaginal, and stool habitats become asymptotically flat at the current sampling depth and sampling efforts. More subjects are needed to reach the saturation for skin and skin-associated habitats.
Figure 2
Figure 2
Shannon diversity comparisons of 22 habitats. One thousand reads were rarefied from each sample. The boxplot shows the minimum, 25th percentile, median, 75th percentile, and the maximum of the data from bottom to top. Oral habitats in general have more even bacterial communities, and vaginal habitats have the lowest Shannon diversity.
Figure 3
Figure 3
Bacterial distribution patterns viewed by rank abundance curves. The genus distributions are illustrated by rank abundance curves. The x-axis represents the ranked genera from high to low. The y-axis shows the average relative abundance for a given genus. Twenty-two different line shapes and nine different colors represent the 22 habitats in this study. One or a few genera dominate each habitat with a long tail representing rare genera. This bacterial distribution pattern agrees with the species abundance pattern in other environments.
Figure 4
Figure 4
Cosmopolitan and endemic aspects of human microbiota. The relative abundance and prevalence of each taxon from anterior nares is plotted to indicate the cosmopolitan and endemic features of human microbiota. Each dot represents a genus. The x-axis represents the fraction of subjects carrying a given genus (prevalence). The y-axis shows the average fractional abundance (m ± se) of that genus in those subjects. In general, highly abundant genera tend to be found in more subjects while lower abundance genera are less widely distributed. However, some high abundance genera are harbored by only a subset of subjects
Figure 5
Figure 5
Biodiversity correlation between habitats. The symmetric plot was used to show the association of biodiversity between paired habitats. The size and the redness of the circle represent the degree of correlation. Large size and deep redness indicate strong correlation. The large red circles on the diagonal line represent self-comparisons. Proximal habitats have similar alpha and beta diversity. (A) Alpha diversity association. The association of bacterial richness of different habitats from the same individuals is expressed by the Spearman correlation coefficient. (B) Beta diversity association. Mantel correlation was used to compare the Bray-Curtis dissimilarity matrix.
Figure 6
Figure 6
Bacterial community variation. Overall the variation of bacterial community for each habitat was evaluated by the over-dispersion parameter theta (m ± sd) from the Dirichlet-multinomial model. Higher theta indicates higher variation and vice versa. The variation within a bacterial community was calculated at 1,000, 3,000, 6,000, and 9,000 read depths as shown by different colors. No significant difference was found in bacterial community variation at different read depths.
Figure 7
Figure 7
Taxa distribution across habitats. Thirty-nine genera present in at least one subject for all 18 HMP habitats are plotted. Each symbol represents a habitat. The y-axis shows the sample prevalence of the genera calculated as the number of samples who harbor the genus divided by the total number of subjects. Using this criterion, 12 of these genera are spread across all 22 habitats.
Figure 8
Figure 8
Community stability over time. The longitudinal studies were based on 18 habitats from HMP. The similarity of the bacterial communities of each subject between two sampling points was evaluated by Spearman correlation coefficient (y-axis). Oral habitats and stool showed higher correlation between visits; skin and vaginal habitats showed lower correlation between visits. The variation of community stability between subjects is especially high in the skin habitats.

Similar articles

Cited by

References

    1. Fierer N. Microbial biogeography: patterns in microbial diversity across space and time. Washington, DC: ASM Press; 2008.
    1. Ley RE, Turnbaugh PJ, Klein S, Gordon JI. Microbial ecology: human gut microbes associated with obesity. Nature. 2006;14:1022–1023. doi: 10.1038/4441022a. - DOI - PubMed
    1. Smith B, Bode S, Petersen BL, Jensen TK, Pipper C, Kloppenborg J, Boye M, Krogfelt KA, Molbak L. Community analysis of bacteria colonizing intestinal tissue of neonates with necrotizing enterocolitis. BMC Microbiol. 2011;14:73. doi: 10.1186/1471-2180-11-73. - DOI - PMC - PubMed
    1. Donders GG, Bosmans E, Dekeersmaecker A, Vereecken A, Van Bulck B, Spitz B. Pathogenesis of abnormal vaginal bacterial flora. Am J Obstet Gynecol. 2000;14:872–878. doi: 10.1016/S0002-9378(00)70338-3. - DOI - PubMed
    1. Parracho HM, Bingham MO, Gibson GR, McCartney AL. Differences between the gut microflora of children with autistic spectrum disorders and that of healthy children. J Med Microbiol. 2005;14:987–991. doi: 10.1099/jmm.0.46101-0. - DOI - PubMed

Publication types

Substances