. 2013 Jun;169(3):604-18.
doi: 10.1111/bph.12103.

Prostaglandin E₂-induced intercellular adhesion molecule-1 expression is mediated by cAMP/Epac signalling modules in bEnd.3 brain endothelial cells

Affiliations

Prostaglandin E₂-induced intercellular adhesion molecule-1 expression is mediated by cAMP/Epac signalling modules in bEnd.3 brain endothelial cells

Tae Yeop Park et al. Br J Pharmacol. 2013 Jun.

Abstract

Background and purpose: Prostaglandin E₂ (PGE₂) has been implicated in the regulation of adhesion molecules, leukocyte adhesion and infiltration into inflamed site. However, the underlying mechanism therein involved remains ill-defined. In this study, we explored its cellular mechanism of action in the regulation of the intercellular adhesion molecule-1 (ICAM-1) expression in the brain endothelial cells.

Experimental approach: bEnd.3 cells, the murine cerebrovascular endothelial cell line and primary mouse brain endothelial cells were treated with PGE₂ with or without agonists/antagonists of PGE₂ receptors and associated signalling molecules. ICAM-1 expression, Akt phosphorylation and activity of NF-κB were determined by reverse transcription polymerase chain reaction (RT-PCR), immunoblot analysis, luciferase assay and immunocytochemistry.

Key results: PGE₂ significantly up-regulated the expression of ICAM-1, which was blocked by EP4 antagonist (ONO-AE2-227) and knock-down of EP4. PGE₂ effects were mimicked by forskolin, dibutyryl cAMP (dbcAMP) and an exchange protein directly activated by cAMP (Epac) activator (8-Cpt-cAMP) but not a protein kinase A activator (N⁶-Bnz-cAMP). PGE₂-induced ICAM-1 expression was reduced by knock-down of Epac1. A PI3K specific inhibitor (LY294002), Akt inhibitor VIII (Akti) and NF-κB inhibitors (Bay-11-7082 and MG-132) attenuated the induction of ICAM-1 by PGE₂. PGE₂, dbcAMP and 8-Cpt-cAMP induced the phosphorylation of Akt, IκB kinase and IκBα and the translocation of p65 to the nucleus and increased NF-κB dependent reporter gene activity, which was diminished by Akti.

Conclusion and implications: Our findings suggest that PGE₂ induces ICAM-1 expression via EP4 receptor and Epac/Akt/NF-κB signalling pathway in bEnd.3 brain endothelial cells, supporting its pathophysiological role in brain inflammation.


Figures

Figure 1
Figure 1
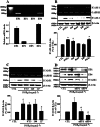
PGE2 induces ICAM-1 expression and leukocyte-endothelial adhesion. (A) Murine cerebrovascular endothelial cell line bEnd.3 cells and (B) primary cultured mouse brain endothelial cells were incubated with varying concentrations of PGE2 (0.01∼10 ng·mL−1) for 4 h (RT-PCR) or 24 h (immunoblot). Data are representative of three separate experiments. Values are mean ± SE of protein levels of ICAM-1 relative to β-actin (n = 3). *P < 0.05 compared with control (CTL). (C) bEnd.3 cells were treated with PGE2 (1 ng·mL−1) for indicating time and protein levels of ICAM-1 were determined by immunoblot. Data are representative of three separate experiments. Values are mean ± SE of protein levels of ICAM-1 relative to β-actin (n = 3). *P < 0.05 CTL. (D) PGE2 stimulated adherence of U937 monocytes to bEnd.3 brain endothelial cells. bEnd.3 cells were treated with varying concentrations of PGE2 (0.01∼10 ng·mL−1) or 1 μg·mL−1 LPS for 24 h and further incubated with CellTracker™ Orange prelabelled U937 cells (4 × 10⁵ cells·mL−1) at 37°C for 1 h. Adhered monocytes were imaged under Axiovert 200 inverted microscope. Data are presented as mean ± SE of three independent measurements. *P < 0.05 compared with control.
Figure 2
Figure 2
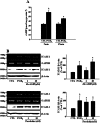
EP1 and EP4 receptors are associated with PGE2-induced ICAM-1 expression. (A) Expression of EP receptor subtypes in bEnd.3 cells. Cells (1 × 10⁵ cells·mL−1) were cultured in DMEM supplemented with 10% FBS and 100 U·mL−1 penicillin/streptomycin at 37°C for 24 h, and total RNA was extracted, and subjected to real-time PCR for EP1, EP2, EP3 and EP4 mRNA using the respective primers as described in Methods. Amplicons for each EP receptor were obtained with correct size. Values represent the mean ± SE of mRNA levels of the genes relative to murine GAPDH expression (n = 3). (B) Cells were treated with EP receptor subtype selective agonists sulprostone (Sul; EP1/3, 1 nM), butaprost (Buta; EP2, 1 μM), ONO-AE-248 (248; EP3, 1 μM) or 1-OH-PGE1 (PGE1; EP2/4, 1 μM) for 4 h (for RT-PCR) or 24 h (for immunoblot). Data are representative of four separate experiments. Values are mean ± SE of protein levels of ICAM-1 relative to β-actin (n = 4). *P < 0.05 compared with control (CTL). (C) Cells were incubated with selective EP antagonists (EP1: ONO-8713, 10 μM; EP3: ONO-AE3-240, 10 μM; EP4: ONO-AE2-227, 10 μM) in the presence of PGE2 (1 ng·mL−1) for 4 h (for RT-PCR) or 24 h (for immunoblot). Data are representative of four independent experiments. Values are mean ± SE of protein levels of ICAM-1 relative to β-actin (n = 4). *P < 0.05 CTL, #P < 0.05 compared with PGE2 alone. (D) EP1 and EP4 receptors were deleted with siRNA as described in Methods. The levels of EP1, EP4 and ICAM-1 proteins were determined by immunoblot at 24 h. Data are representative of four independent experiments. Values are mean ± SE of protein levels of ICAM-1 relative to β-actin (n = 4). *P < 0.05 compared with control (CTL), #P < 0.05 compared with PGE2 alone.
Figure 3
Figure 3
cAMP mediates PGE2-induced ICAM-1 expression. (A) PGE2 increases cAMP levels in bEnd.3 cells. Cells (1 × 10⁵ cells·mL−1) were treated with PGE2 (1 ng·mL−1) for indicated times, then cellular cAMP levels were measured as described in Methods. Data (mean ± SE of three separate measurements) are expressed as pmoles of cAMP·mg-protein−1. *P < 0.05 compared with time matched control (CTL). (B) bEnd.3 cells were incubated with dibutyryl cAMP (dbcAMP, 1 and 10 μM) or forskolin (1 and 10 nM). The levels of ICAM-1 mRNA and protein were determined by RT-PCR and immunoblot at 4 h and 24 h, respectively. Data are representative of three independent experiments. Values are mean ± SE of protein levels of ICAM-1 relative to β-actin (n = 3). *P < 0.05 compared with control (CTL), #P < 0.05 compared with PGE2 alone.
Figure 4
Figure 4
Epac but not protein kinase A mediates PGE2-induced ICAM-1 expression in bEnd.3 cells. (A) PGE2 activates two key receptors for cAMP, PKA and Epac as assessed by CREB phosphorylation and Rap1-GTP formation. Cells were treated with PGE2 (1 ng·mL−1), dbcAMP (10 μM), 8-(4-chlorophenylthio)-2′-O-methyl adenosine 3′5′-cyclic monophosphate (8-Cpt-cAMP, 100 μM), an Epac activator or N6-benzoyladensine-3′,5′-cyclic monophosphate (N6-Bnz-cAMP, 100 μM), a PKA activator for 15 min. Rap1-GTP formation was assessed by pulling down the active form of Rap1 with GST-RalGDS RBD as described in Methods. CREB phosphorylation was determined by immunoblot. Data are representative of three independent experiments. (B, C) Epac mediates PGE2-induced ICAM-1 expression in bEnd.3 cells. Cells were treated with PGE2 (1 ng·mL−1) or 8-Cpt-cAMP (1∼100 μM). In a separate experiment, Epac1 was deleted with siRNA for Epac1 as described in Methods. The levels of ICAM-1 mRNA and protein were determined by RT-PCR and immunoblot at 4 h and 24 h, respectively. Data are representative of four independent experiments. Values are mean ± SE of protein levels of ICAM-1 relative to β-actin (n = 4). *P < 0.05 compared with control (CTL), #P < 0.05 compared with PGE2 alone. (D–F) PKA appears not involved in PGE2-induced ICAM-1 expression. Cells were treated with N6-Bnz-cAMP (1∼100 μM) alone or H89 (1∼10 μM), a PKA inhibitor in the presence of PGE2 (1 ng·mL−1). In a separate experiment, PKA-Cα, a catalytically active form of PKA, was transiently transfected as described in Methods. The levels of ICAM-1 mRNA and protein were determined by RT-PCR and immunoblot at 4 h and 24 h, respectively. Data are representative of three independent experiments. Values are mean ± SE of protein levels of ICAM-1 relative to β-actin (n = 3). *P < 0.05 compared with control (CTL).
Figure 5
Figure 5
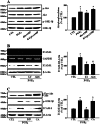
Epac-mediated signalling proceeds through PI3K and Akt. (A) The activation of Epac increases the phosphorylation of Akt. bEnd.3 cells were treated with PGE2 (1 ng·mL−1), dbcAMP (10 μM) or 8-Cpt-cAMP (100 μM) for 15 min and phosphorylation levels of Akt and GSK-3β were evaluated with immunoblot analysis. Data are representative of four independent experiments. Values are mean ± SE of levels of phosphorylated Akt relative to total Akt (n = 4). *P < 0.05 compared with control (CTL). (B) PI3K/Akt signalling pathway is involved in PGE2-induced ICAM-1 expression. Cell were pretreated with LY294002 (LY, 10 μM) or Akt inhibitor VIII (Akti, 100 nM) for 30 min and further incubated with PGE2 (1 ng·mL−1) for 4 h (RT-PCR) or 24 h (immunoblot). Data are representative of three independent experiments. Values are mean ± SE of protein levels of ICAM-1 relative to β-actin (n = 3). *P < 0.05 compared with control (CTL), #P < 0.05 compared with PGE2 alone. (C) Cell were transfected with pcDNA3 control vectors (CTL), dominant-negative (DN) Akt or catalytically active (CA) Akt construct using Lipofectamine™. After 36 h, transfected cell were treated with PGE2 (1 ng·mL−1) for another 12 h and cell lysates were subjected to immunoblotting. Data are representative of four independent experiments. Values are mean ± SE of protein levels of ICAM-1 relative to β-actin (n = 4). *P < 0.05 compared with control (CTL), #P < 0.05 compared with PGE2 alone.
Figure 6
Figure 6
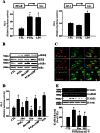
NF-κB activation is a major component in PGE2-induced ICAM-1 expression. (A) PGE2 increases the transcriptional activity of NF-κB but not AP-1 in bEnd.3 cells. Cells were transfected with NF-κB or AP-1 binding site (2x)-luciferase reporter plasmid for 24 h and further incubated with PGE2 (1 ng·mL−1) or LPS (1 μg·mL−1) for 12 h. Luciferase activities were measured as described in Methods and relative luciferase activity (RLA) was normalized with β-galactosidase activity. Data are presented as mean ± SE of three independent measurements. *P < 0.01 compared with control (CTL). (B) PGE2-cAMP-Epac signaling axis induces the activation of NF-κB through IKKβ phosphorylation. bEnd.3 cells were exposed to PGE2 (1 ng·mL−1), dbcAMP (10 μM) or 8-Cpt-cAMP (100 μM) for 15 min and the phosphorylation of IKKβ and IκBα was assessed by immunoblot. Data are representative of three independent experiments. (C) PGE2 and 8-Cpt-cAMP stimulate the translocation of p65 to the nucleus. Cells were exposed to PGE2 (1 ng·mL−1) or 8-Cpt-cAMP (100 μM) for 15 min and the translocation of p65 was determined by immunocytochemistry (green, Alexa Fluor 488; red, Hoechst 33258). Data are representative of three independent experiments. (D) Akti, an Akt inhibitor diminishes NF-κB dependent reporter gene activity induced by PGE2, dbcAMP and 8-Cpt-AMP. Cells were transfected with NF-κB binding site (2x)-luciferase reporter plasmid for 24 h. Transfected cells were pretreated with Akti (100 nM) for 30 min and incubated with PGE2 (1 ng·mL−1), dbcAMP (10 μM), or 8-Cpt-cAMP (100 μM) for another 12 h. Data are presented as mean ± SE of three independent measurements. *P < 0.05 compared with control (CTL), #P < 0.05 compared with PGE2, dbcAMP and 8-Cpt-cAMP alone. (E) NF-κB inhibitors reduce PGE2-induced ICAM-1 expression. Cells were incubated with PGE2 (1 ng·mL−1) in the presence of NF-κB inhibitors such as MG132 (an IκBα degradation inhibitor, 10 μM) and Bay11-7082 (an IκBα phosphorylation inhibitor, 5 μM). The levels of ICAM-1 mRNA and protein were determined by RT-PCR and immunoblot at 4 h and 24 h, respectively. Data are representative of three independent experiments.
Figure 7
Figure 7
PGE2 induces ICAM-1 expression via EP4 receptor and Epac/Akt/NF-kB signaling pathway in primary cultured mouse brain endothelial cells. Cells were treated with ONO-AE2-227 (AE-227, an EP4 antagonist, 10 μM), brefeldin A (BFA, an Epac inhibitor, 10 μM), Akti (100 nM) or MG132 (10 μM) in the presence of PGE2 (1 ng·mL−1) for 24 h and protein levels of ICAM-1 were determined by immunoblot. Data are representative of four separate experiments. Values are mean ± SE of protein levels of ICAM-1 relative to β-actin (n = 4). *P < 0.05 compared with control (CTL), #P < 0.05 compared with PGE2 alone.
Figure 8
Figure 8
PGE2 enhances leukocyte adhesion via EP4 receptor and Epac/Akt/NF-kB signaling pathway in bEnd.3 cells. Cells were treated with ONO-AE2-227 (AE-227, an EP4 antagonist, 10 μM), brefeldin A (BFA, an Epac inhibitor, 10 μM), Akti (100 nM) or MG132 (10 μM) in the presence of PGE2 (1 ng·mL−1) for 24 h and further incubated with CellTracker™ Orange prelabelled U937 cells (4 × 10⁵ cells·mL−1) at 37°C for 1 h. Adhered monocyte cells were imaged under Axiovert 200 inverted microscope. Data are presented as mean ± SE of three independent measurements. *P < 0.05 compared with control (CTL), #P < 0.05 compared with PGE2 alone.

Similar articles

Cited by

References

    1. Aid S, Bosetti F. Targeting cyclooxygenases-1 and -2 in neuroinflammation: therapeutic implications. Biochimie. 2011;93:46–51. - PMC - PubMed
    1. Aktan S, Aykut C, Oktay S, Yegen B, Keles E, Aykac I, et al. The alterations of leukotriene C4 and prostaglandin E2 levels following different ischemic periods in rat brain tissue. Prostaglandins Leukot Essent Fatty Acids. 1991;42:67–71. - PubMed
    1. Alexander SPH, Mathie A, Peters JA. Guide to receptors and channels (GRAC) Br J Pharmacol. 2011;164(Suppl. 1):S1–S324. - PMC - PubMed
    1. Aloisi F, De Simone R, Columba-Cabezas S, Levi G. Opposite effects of interferon-gamma and prostaglandin E2 on tumor necrosis factor and interleukin-10 production in microglial: a regulatory loop controlling microglia pro- and anti-inflammatory activities. J Neurosci Res. 1999;56:571–580. - PubMed
    1. Andreasson K. Emerging roles of PGE2 receptors in models of neurological disease. Prostaglandins Other Lipid Mediat. 2010;91:104–112. - PMC - PubMed

Publication types

MeSH terms