. 2013 Feb 7;12(2):224-37.
doi: 10.1016/j.stem.2012.11.023. Epub 2013 Jan 11.

Dynamic chromatin remodeling mediated by polycomb proteins orchestrates pancreatic differentiation of human embryonic stem cells

Affiliations

Dynamic chromatin remodeling mediated by polycomb proteins orchestrates pancreatic differentiation of human embryonic stem cells

Ruiyu Xie et al. Cell Stem Cell. .

Abstract

Embryonic development is characterized by dynamic changes in gene expression, yet the role of chromatin remodeling in these cellular transitions remains elusive. To address this question, we profiled the transcriptome and select chromatin modifications at defined stages during pancreatic endocrine differentiation of human embryonic stem cells. We identify removal of Polycomb group (PcG)-mediated repression on stage-specific genes as a key mechanism for the induction of developmental regulators. Furthermore, we discover that silencing of transitory genes during lineage progression associates with reinstatement of PcG-dependent repression. Significantly, in vivo- but not in vitro-differentiated endocrine cells exhibit close similarity to primary human islets in regard to transcriptome and chromatin structure. We further demonstrate that endocrine cells produced in vitro do not fully eliminate PcG-mediated repression on endocrine-specific genes, probably contributing to their malfunction. These studies reveal dynamic chromatin remodeling during developmental lineage progression and identify possible strategies for improving cell differentiation in culture.


Figures

Figure 1
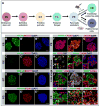
Figure 1. Differentiation of hESCs into pancreatic endoderm and endocrine cells
(A) Schematic of the human embryonic stem cell (hESC)-based differentiation strategy. (B–N) Immunofluorescence staining of sections from cell aggregates for stage-specific markers shows synchronous and efficient progression of hESCs through the differentiation steps. Polyhormonal cells (PH) generated in vitro express insulin (INS) together with glucagon (GCG) and somatostatin (SST) (H). CHGA+ (chromogranin A) cells express little PDX1 (I) and INS+ cells are not uniformly NKX6.1+ (J). Retrieved grafts 20 weeks post implantation display INS+ cells negative for GCG or SST (L) but expressing PDX1 (M) and NKX6.1 (N). DE, definitive endoderm; GT, primitive gut tube; FG, posterior foregut; PE, pancreatic endoderm; FE, in vivo-differentiated functional endocrine cells. Scale bars = 50μm. See also Figure S1; Table S1.
Figure 2
Figure 2. Stage-specific mRNA clusters during pancreatic endocrine differentiation of hESCs
(A) Bayesian clustering of mRNA profiles at the ES, definitive endoderm (DE), primitive gut tube (GT), posterior foregut (FG), pancreatic endoderm (PE), and functional endocrine (FE) stage identifies stage-specific signature (sig.) genes. Enriched Gene Ontology categories of DE (B), PE (C), and FE signature genes (D). See also Table S2.
Figure 3
Figure 3. Genome-wide changes in H3K4me3 and H3K27me3 modification patterns during pancreatic endocrine differentiation
(A) Venn diagram of global H3K27me3 and H3K4me3 patterns showing gain and loss of bivalent domains at each step during progression of hESCs to functional endocrine (FE) cells. Overall numbers of bivalent domains are stable from the ES to the pancreatic endoderm (PE) stage, but decrease significantly at the FE stage. (B) Gene ontology (GO) analysis of bivalent genes in hESCs resolving to H3K4me3 (left panel) or H3K27me3 (right panel) during pancreatic differentiation. GO terms are shown on the y-axis; corrected P values along the x-axis. Pie charts (middle) show that bivalent genes in hESCs resolve to either H3K4me3 or H3K27me3 mostly at the transition to the FE stage. (C) At each stage, bivalent domains are predominantly lost and gained by modifying methylation of H3K27me3. Total numbers of genes are shown on the y-axis. (D) Hierarchical clustering of normalized tag counts for H3K27me3 during differentiation shows that ES, definitive endoderm (DE), and FE are most distinct, while primitive gut tube (GT), posterior foregut (FG), and PE exhibit higher similarity. For the clustering, H3K27me3 tags were counted in a region +/- 2kb around the transcriptional start sites and normalized to RPM (Reads Per Million). See also Figure S2; Table S3.
Figure 4
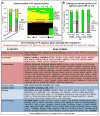
Figure 4. PcG-dependent derepression and repression coincides with activation and silencing of definitive endoderm-specific genes
(A) Definitive endoderm (DE) signature genes separated by H3 methylation patterns in ES cells (horizontal axis) and how these modifications change in DE. Removal of H3K27me3 on bivalent genes is the predominant change. The table lists Gene Ontology categories (P<0.05) of DE signature genes changing from bivalent in ES to H3K4me3 in DE. (B) RT-qPCR of JMJD3 shows significant reduction of JMJD3 mRNA levels after lentiviral transduction of hESCs with two different JMJD3 shRNAs (shRNAs#1 and shRNA#2) compared to a scrambled control (ctrl) shRNA (left panel). RT-qPCR of DE signature genes in control and JMJD3 knockdown cells at the DE stage (middle). ChIP-qPCR demonstrates increased H3K27me3 occupancy on DE gene promoters after JMJD3 knockdown (right panel). (C) Global histone methylation patterns of DE signature genes at ES, DE, primitive gut tube (GT), and posterior foregut (FG) stages shows removal and subsequent reacquisition of H3K27me3 on DE signature genes. (D) Cluster analysis of histone methylation patterns of all DE signature genes resolving from bivalent in ES to H3K4me3 in DE (left panel). mRNA expression profiles (RNA-seq) of genes in each cluster shows a correlation between gain of H3K27me3 and extent of gene repression at the GT stage (% of gene expression in GT relative to DE). Data are shown as mean ± S.E.M. from three technical replicates. The statistical values are * P < 0.05; *** P < 0.001. See also Figure S3 and S4; Table S4.
Figure 5
Figure 5. Transcriptional activation of pancreatic developmental regulators involves reversal of PcG-mediated repression
(A) Comparison of global H3K4me3 and H3K27me3 patterns of primitive gut tube (GT), posterior foregut (FG), and pancreatic endoderm (PE) signature genes vs. all genes in ES cells reveals a higher propensity of stage-specific than random genes to be bivalent in hESCs. (B) Analysis of histone profiles of PE signature genes during pancreas differentiation shows that PE signature genes gradually lose bivalency beginning in GT. (C) PE signature genes separated by H3 methylation patterns in ES cells (horizontal axis) and how these modifications change in PE isolated from late-stage cultures (Late PE). Removal of H3K27me3 on bivalent genes is the predominant change. The table lists Gene Ontology categories (P<0.05) of PE signature genes changing from bivalent in ES to H3K4me3 in Late PE. (D) Cluster analysis of histone methylation patterns of all PE signature genes changing from bivalent in ES to H3K4me3 in FG, PE, or Late PE (left panel). mRNA expression profiles (RNA-seq) of genes in each cluster shows a temporal correlation between removal of H3K27me3 and gene activation (% of gene expression in FG relative to PE). The statistical values are * P < 0.05; *** P < 0.001. DE, definitive endoderm. See also Figure S4 and S5; Table S5.
Figure 6
Figure 6. Induction of endocrine-specific genes involves removal of repressive and acquisition of active histone modifications
(A) Analysis of global H3K4me3 and H3K27me3 patterns shows that in vivo-differentiated functional endocrine (FE) signature genes are more likely to be bivalent in hESCs than random genes (left panel). Cluster analysis of histone methylation patterns reveals that most bivalent FE signature genes maintain bivalency until the pancreatic endoderm (PE) stage and resolve to H3K4me3 at the FE stage (right panel). (B) FE signature genes separated by H3 methylation patterns in PE (horizontal axis) and how these modifications change in FE. Removal of H3K27me3 from the bivalent state and acquisition of H3K4me3 from the unmodified state are the predominant changes. The table lists Gene Ontology categories (P<0.05) of FE signature genes changing their histone modifications from bivalent in PE to H3K4me3 in FE (red) or from unmodified in PE to H3K4me3 in FE (blue). DE, definitive endoderm; GT, primitive gut tube; FG, posterior foregut. See also Figure S4; Table S6.
Figure 7
Figure 7. Aberrant histone modifications of genes inefficiently induced during in vitro endocrine differentiation
(A) Venn diagram comparing genes expressed in in vitro-generated polyhormonal cells (PH) and in vivo-differentiated functional endocrine (FE) cells reveals 1438 genes with higher expression in FE (FE high genes). Genes with < 2-fold difference in expression value between PH and FE are considered common to both cell types. (B) Gene Ontology (GO) analysis of genes with higher expression in FE shows enrichment for GO terms associated with endocrine cell function. GO terms are shown on the y-axis; P values along the x-axis. (C) Hierarchal clustering of mRNA levels for FE high genes in pancreatic endoderm (PE), PH, FE, and human islet donor (HI1 and HI2) samples. (D) Hierarchal clustering of histone modification levels for FE high genes in PE, PH, and human islet samples. (E) Genes highly expressed in FE separated by H3 methylation patterns in PE (horizontal axis) and how these modifications change in FE and PH. A large number of genes losing H3K27me3 or acquiring H3K4me3 during the PE to FE transition are not appropriately modified during in vitro differentiation. The table lists Gene Ontology categories (P<0.05) of FE high genes inappropriately retaining H3K27me3 (red) or failing to acquire H3K4me3 during in vitro compared to in vivo differentiation. See also Figure S6; Table S7.

Similar articles

Cited by

References

    1. Apelqvist A, Li H, Sommer L, Beatus P, Anderson DJ, Honjo T, Hrabe de Angelis M, Lendahl U, Edlund H. Notch signalling controls pancreatic cell differentiation. Nature. 1999;400:877–881. - PubMed
    1. Bernstein BE, Mikkelsen TS, Xie X, Kamal M, Huebert DJ, Cuff J, Fry B, Meissner A, Wernig M, Plath K, et al. A bivalent chromatin structure marks key developmental genes in embryonic stem cells. Cell. 2006;125:315–326. - PubMed
    1. Bhandare R, Schug J, Le Lay J, Fox A, Smirnova O, Liu C, Naji A, Kaestner KH. Genome-wide analysis of histone modifications in human pancreatic islets. Genome Res. 2010;20:428–433. - PMC - PubMed
    1. Blum B, Hrvatin SS, Schuetz C, Bonal C, Rezania A, Melton DA. Functional beta-cell maturation is marked by an increased glucose threshold and by expression of urocortin 3. Nat Biotechnol. 2012;30:261–264. - PMC - PubMed
    1. Boyer LA, Plath K, Zeitlinger J, Brambrink T, Medeiros LA, Lee TI, Levine SS, Wernig M, Tajonar A, Ray MK, et al. Polycomb complexes repress developmental regulators in murine embryonic stem cells. Nature. 2006;441:349–353. - PubMed

Publication types

MeSH terms

Substances