

Mortality among homeless adults in Boston: shifts in causes of death over a 15-year period
- PMID: 23318302
- PMCID: PMC3713619
- DOI: 10.1001/jamainternmed.2013.1604
Mortality among homeless adults in Boston: shifts in causes of death over a 15-year period
Abstract
Background: Homeless persons experience excess mortality, but US-based studies on this topic are outdated or lack information about causes of death. To our knowledge, no studies have examined shifts in causes of death for this population over time.
Methods: We assessed all-cause and cause-specific mortality rates in a cohort of 28 033 adults 18 years or older who were seen at Boston Health Care for the Homeless Program from January 1, 2003, through December 31, 2008. Deaths were identified through probabilistic linkage to the Massachusetts death occurrence files. We compared mortality rates in this cohort with rates in the 2003-2008 Massachusetts population and a 1988-1993 cohort of homeless adults in Boston using standardized rate ratios with 95% confidence intervals.
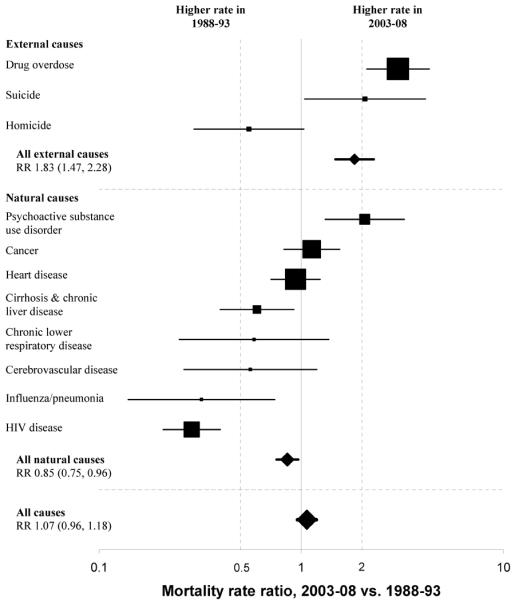
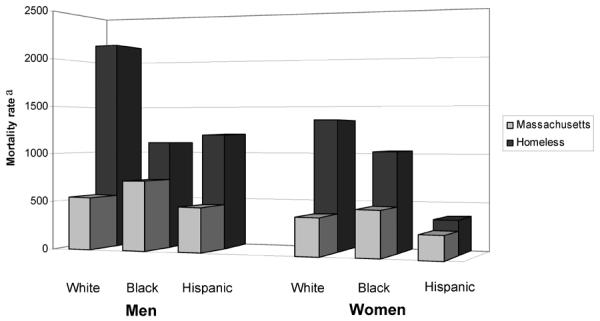
Results: A total of 1302 deaths occurred during 90 450 person-years of observation. Drug overdose (n = 219), cancer (n = 206), and heart disease (n = 203) were the major causes of death. Drug overdose accounted for one-third of deaths among adults younger than 45 years. Opioids were implicated in 81% of overdose deaths. Mortality rates were higher among whites than nonwhites. Compared with Massachusetts adults, mortality disparities were most pronounced among younger individuals, with rates about 9-fold higher in 25- to 44-year-olds and 4.5-fold higher in 45- to 64-year-olds. In comparison with 1988-1993 rates, reductions in deaths from human immunodeficiency virus (HIV) were offset by 3- and 2-fold increases in deaths owing to drug overdose and psychoactive substance use disorders, resulting in no significant difference in overall mortality.
Conclusions: The all-cause mortality rate among homeless adults in Boston remains high and unchanged since 1988 to 1993 despite a major interim expansion in clinical services. Drug overdose has replaced HIV as the emerging epidemic. Interventions to reduce mortality in this population should include behavioral health integration into primary medical care, public health initiatives to prevent and reverse drug overdose, and social policy measures to end homelessness.
Figures
Comment in
-
Overdose fatality and surveillance as a method for understanding mortality trends in homeless populations.JAMA Intern Med. 2013 Jul 8;173(13):1264. doi: 10.1001/jamainternmed.2013.6838. JAMA Intern Med. 2013. PMID: 23836270 Free PMC article. No abstract available.
-
Overdose fatality and surveillance as a method for understanding mortality trends in homeless populations.JAMA Intern Med. 2013 Jul 8;173(13):1264-5. doi: 10.1001/jamainternmed.2013.6849. JAMA Intern Med. 2013. PMID: 23836271 No abstract available.
-
Overdose fatality and surveillance as a method for understanding mortality trends in homeless populations--reply.JAMA Intern Med. 2013 Jul 8;173(13):1265-6. doi: 10.1001/jamainternmed.2013.7766. JAMA Intern Med. 2013. PMID: 23836272 No abstract available.
References
-
- Burt MR, Aron LY, Lee E, Valente J. Helping America's Homeless: Emergency Shelter or Affordable Housing? Urban Institute; Washington, D.C.: 2001. How Many Homeless People Are There? pp. 23–54.
-
- U.S. Department of Housing and Urban Development. Office of Community Planning and Development [Accessed February 29, 2012];The 2010 Annual Homeless Assessment Report to Congress. 2011 http://www.hudhre.info/documents/2010HomelessAssessmentReport.pdf.
-
- Burt MR, Urban Institute . Homelessness: Programs and the People They Serve: Findings of the National Survey of Homeless Assistance Providers and Clients: Technical Report. U.S. Department of Housing and Urban Development; Office of Policy Development and Research; Washington, D.C.: 1999.
-
- Breakey WR, Fischer PJ, Kramer M, et al. Health and mental health problems of homeless men and women in Baltimore. JAMA. 1989 Sep 8;262(10):1352–1357. - PubMed
-
- Wright JD. The Health of Homeless People: Evidence from the National Health Care for the Homeless Program. In: Brickner PW, Scharer LK, Conanan B, Savarese M, Scanlan BC, editors. Under the Safety Net: The Health and Social Welfare of the Homeless in the United States. Norton; New York: 1990. pp. 15–31.
Publication types
MeSH terms
Grants and funding
LinkOut - more resources
Full Text Sources
Other Literature Sources
Medical
