. 2013 Jan 7;14(1):3888.
doi: 10.1120/jacmp.v14i1.3888.

A study on image quality provided by a kilovoltage cone-beam computed tomography

Affiliations

A study on image quality provided by a kilovoltage cone-beam computed tomography

Julia Garayoa et al. J Appl Clin Med Phys. .

Abstract

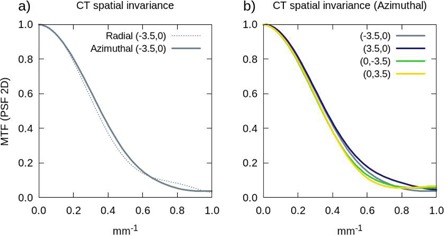
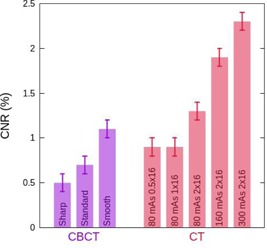
The image-guided radiotherapy technique (IGRT) makes use of imaging devices to verify the positions of the target volume and organs at risk during the treatment sessions. In this work we evaluate the image quality provided by an imaging system based on a kilovoltage cone-beam CT, and explore its ability to perform IGRT and adaptive radiotherapy. We analyze the accuracy of the image slice width, the spatial resolution using the MTF function, the image uniformity, the signal-to-noise ratio, the contrast-to-noise ratio, the low-contrast sensitivity, and the HU linearity with density. The studied parameters are evaluated in an objective and quantitative way, allowing for a direct comparison with other imaging devices. We conclude that the analyzed cone-beam imaging system is adequate to accurately perform IGRT within its clinical use, despite the high level of noise present in a cone beam caused by scatter. We also point out the presence of a bowtie wobble artifact in the reconstructed images. Nevertheless, we conclude that these features do not limit the capability of the system to perform adaptive radiotherapy in most cases.


Figures

Figure 1
Figure 1
Images of the Catphan 600 phantom acquired with the CBCT system: (a) CTP404 module: HU verification, (b) CTP404 module: spatial linearity and pixel size verification, and slice width measurement, (c) CTP528 module: modulation transfer function (MTF) determination using the bar pattern, (d) CTP591 module: modulation transfer function determination using the point spread function, (e) CTP486 module: HU uniformity, (f) CTP515 module: low‐contrast sensitivity evaluation.
Figure 2
Figure 2
CT spatial invariance: (a) equivalency between the azimuthal (solid) and radial (dashed) components of the modulation transfer function (MTF) determined with the point spread function with the point object located at (3.5, 0.0); (b) equivalency between the azimuthal components of the MTF determined with the point spread function for various locations of the point object: (3.5, 0.0), (3.5, 0.0), (0, 3.5), and (0, 3.5).
Figure 3
Figure 3
Modulation transfer functions (MTF) obtained with the three methods considered: 1D analytical fit of the point spread function (PSF 1D: red), 2D Fourier transform of the point spread function (PSF 2D: purple), and the bar pattern method( 20 ) (Pattern: green). Plot (a) shows the results obtained in the CT, and plot (b) the ones corresponding to the CBCT. The solid lines represent the mean values of the five consecutive measurements carried out, and the error bars (Pattern) or shaded regions (PSF) denote their first standard deviation.
Figure 4
Figure 4
Modulation transfer function (MTF) (a) obtained with the PSF 2D method in the CBCT system for the three studied reconstruction filters: sharp (orange), standard (purple), and smooth (light blue); (b) comparison between the MTF functions corresponding to the CBCT with the standard reconstruction filter (purple) and the CT with 80 mAs and the detector configuration 2×16 (pink). The solid lines represent the mean values of the five consecutive measurements carried out, and the shaded regions denote their first standard deviation.
Figure 5
Figure 5
Signal‐to‐noise ratio (SNR) for the CBCT (purple) using three reconstruction filters (from left to right: sharp, standard, and smooth), and for the CT (red) using several combinations of tube current and detector configurations (from left to right: 80 mAs 0.5×16, 80 mAs 1×16, 80 mAs 2×16, 160 mAs 2×16, and 300 mAs 2×16).
Figure 6
Figure 6
CBCT tomographic image for the Varian uniform phantom (left) and a crosssectional profile (right). The effect of bowtie wobble appears as a bright ring.
Figure 7
Figure 7
Contrast‐to‐noise ratio (CNR) for the CBCT (purple) using three reconstruction filters (from left to right: sharp, standard, and smooth) and for the CT (red) using several combinations of tube current and detector configurations (from left to right: 80 mAs 0.5×16, 80 mAs 1×16, 80 mAs 2×16, 160 mAs 2×16, and 300 mAs 2×16).
Figure 8
Figure 8
Contrast‐detail curve. Plot (a) shows the curves for the CBCT obtained with three reconstruction filters: sharp (orange), standard (purple), and smooth (light blue). Plot (b) shows the curves for the CT obtained using several combinations of tube current and detector configurations: 80 mAs 0.5×16 (dark blue), 80 mAs 1×16 (grey), 80 mAs 2×16 (pink), 160 mAs 2×16 (green), and 300 mAs 2×16 (yellow). Plot (c) shows a comparison between the contrast‐detail curves obtained in the CBCT with the standard reconstruction filter (purple) and in the CT with 80 mAs 2×16 (pink). The solid lines represent the mean values of the five consecutive measurements carried out, and the shaded regions denote their first standard deviation. The standard deviations are not displayed in plots (a) and (b) to make the plots clearer.
Figure 9
Figure 9
HU number versus relative density curve obtained in the CBCT (purple) with the materials present in the CTP404 Catphan 600 phantom and the reference HU numbers provided by the manufacturer (red).

References

    1. Herman MG, Balter JM, Jaffray DA, et al. Clinical use of electronic portal imaging: Report of AAPM Radiation Therapy Committee Task Group 58. Med Phys. 2001;28(5):712–37. - PubMed
    1. Ding GX, Duggan DM, Coffey CW, et al. A study on adaptive IMRT treatment planning using kV cone‐beam CT. Radiother Oncol. 2007;85(1):116–25. - PubMed
    1. Nijkamp J, Pos FJ, Nuver TT, et al. Adaptive radiotherapy for prostate cancer using kilovoltage cone‐beam computed tomography: first clinical results. Int J Radiat Oncol Biol Phys. 2008;70(1):75–82. - PubMed
    1. Hatton JA, Greer PB, Tang C, et al. Does the planning dose‐volume histogram represent treatment doses in image‐guided prostate radiation therapy? Assessment with cone‐beam computerised tomography scans. Radiother Oncol. 2011;98(2):162–68. - PubMed
    1. Létourneau D, Wong R, Moseley D, et al. Online planning and delivery technique for radiotherapy of spinal metastases using cone‐beam CT: image quality and system performance. Int J Radiat Oncol Biol Phys. 2007;67(4):1229–37. - PubMed

Publication types

MeSH terms

LinkOut - more resources