

A requirement for Nedd9 in luminal progenitor cells prior to mammary tumorigenesis in MMTV-HER2/ErbB2 mice
- PMID: 23318423
- PMCID: PMC3628996
- DOI: 10.1038/onc.2012.607
A requirement for Nedd9 in luminal progenitor cells prior to mammary tumorigenesis in MMTV-HER2/ErbB2 mice
Abstract
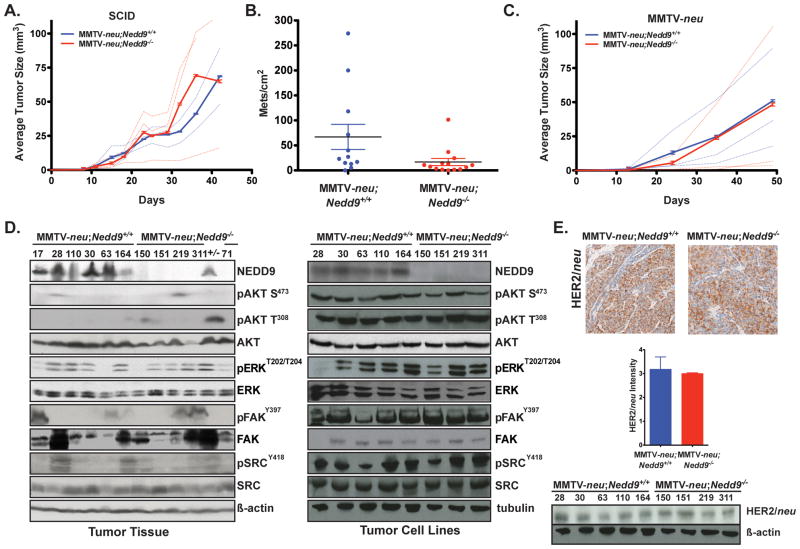
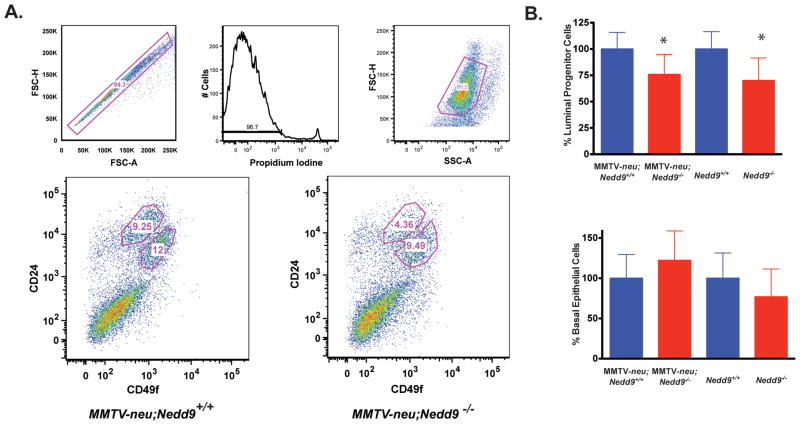
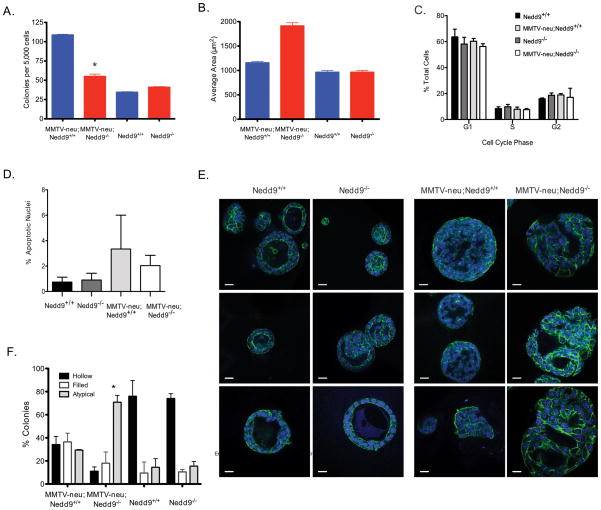
Overexpression of the NEDD9/HEF1/Cas-L scaffolding protein is frequent, and drives invasion and metastasis in breast, head and neck, colorectal, melanoma, lung and other types of cancer. We have examined the consequences of genetic ablation of Nedd9 in the MMTV-HER2/ERBB2/neu mouse mammary tumor model. Unexpectedly, we found that only a limited effect on metastasis in MMTV-neu;Nedd9(-/-) mice compared with MMTV-neu;Nedd9(+/+) mice, but instead a dramatic reduction in tumor incidence (18 versus 80%), and a significantly increased latency until tumor appearance. Orthotopic reinjection and tail-vein injection of cells arising from tumors, coupled with in vivo analysis, indicated tumors arising in MMTV-neu;Nedd9(-/-) mice had undergone mutational selection that overcame the initial requirement for Nedd9. To better understand the defects in early tumor growth, we compared mammary progenitor cell pools from MMTV-neu;Nedd9(-/-) versus MMTV-neu;Nedd9(+/+) mice. The MMTV-neu;Nedd9(-/-) genotype selectively reduced both the number and colony-forming potential of mammary luminal epithelial progenitor cells, while not affecting basal epithelial progenitors. MMTV-neu;Nedd9(-/-) mammospheres had striking defects in morphology and cell polarity. All of these defects were seen predominantly in the context of the HER2/neu oncogene, and were not associated with randomization of the plane of mitotic division, but rather with depressed expression the cell attachment protein FAK, accompanied by increased sensitivity to small molecule inhibitors of FAK and SRC. Surprisingly, in spite of these significant differences, only minimal changes were observed in the gene expression profile of Nedd9(-/-) mice, indicating critical Nedd9-dependent differences in cell growth properties were mediated via post-transcriptional regulation of cell signaling. Coupled with emerging data indicating a role for NEDD9 in progenitor cell populations during the morphogenesis of other tissues, these results indicate a functional requirement for NEDD9 in the growth of mammary cancer progenitor cells.
Conflict of interest statement
The authors declare no conflict of interest.
Figures


Similar articles
-
Enhanced genetic instability and dasatinib sensitivity in mammary tumor cells lacking NEDD9.Cancer Res. 2010 Nov 1;70(21):8907-16. doi: 10.1158/0008-5472.CAN-10-0353. Epub 2010 Oct 12. Cancer Res. 2010. PMID: 20940402 Free PMC article.
-
NEDD9 promotes oncogenic signaling in mammary tumor development.Cancer Res. 2009 Sep 15;69(18):7198-206. doi: 10.1158/0008-5472.CAN-09-0795. Epub 2009 Sep 8. Cancer Res. 2009. PMID: 19738060 Free PMC article.
-
Frequent overexpression of AMAP1, an Arf6 effector in cell invasion, is characteristic of the MMTV-PyMT rather than the MMTV-Neu human breast cancer model.Cell Commun Signal. 2018 Jan 5;16(1):1. doi: 10.1186/s12964-017-0212-z. Cell Commun Signal. 2018. PMID: 29329590 Free PMC article.
-
Stem cells and mammary cancer in mice.Stem Cell Rev. 2005;1(3):215-23. doi: 10.1385/SCR:1:3:215. Stem Cell Rev. 2005. PMID: 17142858 Review.
-
Molecular basis for HEF1/NEDD9/Cas-L action as a multifunctional co-ordinator of invasion, apoptosis and cell cycle.Cell Biochem Biophys. 2007;48(1):54-72. doi: 10.1007/s12013-007-0036-3. Cell Biochem Biophys. 2007. PMID: 17703068 Free PMC article. Review.
Cited by
-
NEDD9/Arf6-dependent endocytic trafficking of matrix metalloproteinase 14: a novel mechanism for blocking mesenchymal cell invasion and metastasis of breast cancer.Oncogene. 2015 Jul;34(28):3662-75. doi: 10.1038/onc.2014.297. Epub 2014 Sep 22. Oncogene. 2015. PMID: 25241893 Free PMC article.
-
Overexpression of Nedd9 is a prognostic marker of human gastric cancer.Med Oncol. 2014 Jul;31(7):33. doi: 10.1007/s12032-014-0033-5. Epub 2014 Jun 7. Med Oncol. 2014. PMID: 24906654
-
A new role of SNAI2 in postlactational involution of the mammary gland links it to luminal breast cancer development.Oncogene. 2015 Sep 3;34(36):4777-90. doi: 10.1038/onc.2015.224. Epub 2015 Jun 22. Oncogene. 2015. PMID: 26096931 Free PMC article.
-
NEDD9 promotes oncogenic signaling, a stem/mesenchymal gene signature, and aggressive ovarian cancer growth in mice.Oncogene. 2018 Aug;37(35):4854-4870. doi: 10.1038/s41388-018-0296-y. Epub 2018 May 18. Oncogene. 2018. PMID: 29773902 Free PMC article.
-
CAS proteins in health and disease: an update.IUBMB Life. 2014 Jun;66(6):387-95. doi: 10.1002/iub.1282. Epub 2014 Jun 24. IUBMB Life. 2014. PMID: 24962474 Free PMC article. Review.
References
-
- Perou CM, Sorlie T, Eisen MB, van de Rijn M, Jeffrey SS, Rees CA, et al. Molecular portraits of human breast tumours. Nature. 2000;406(6797):747–52. [101038/35021093] - PubMed
-
- Slamon DJ, Clark GM, Wong SG, Levin WJ, Ullrich A, McGuire WL. Human breast cancer: correlation of relapse and survival with amplification of the HER-2/neu oncogene. Science. 1987 Jan 9;235(4785):177–82. - PubMed
-
- Slamon DJ, Godolphin W, Jones LA, Holt JA, Wong SG, Keith DE, et al. Studies of the HER-2/neu proto-oncogene in human breast and ovarian cancer. Science. 1989 May 12;244(4905):707–12. - PubMed
Publication types
MeSH terms
Substances
Grants and funding
LinkOut - more resources
Full Text Sources
Other Literature Sources
Molecular Biology Databases
Research Materials
Miscellaneous
