. 2014 Jan 30;33(5):643-52.
doi: 10.1038/onc.2012.614. Epub 2013 Jan 14.

Induction of cells with cancer stem cell properties from nontumorigenic human mammary epithelial cells by defined reprogramming factors

Affiliations

Induction of cells with cancer stem cell properties from nontumorigenic human mammary epithelial cells by defined reprogramming factors

M Nishi et al. Oncogene. .

Abstract

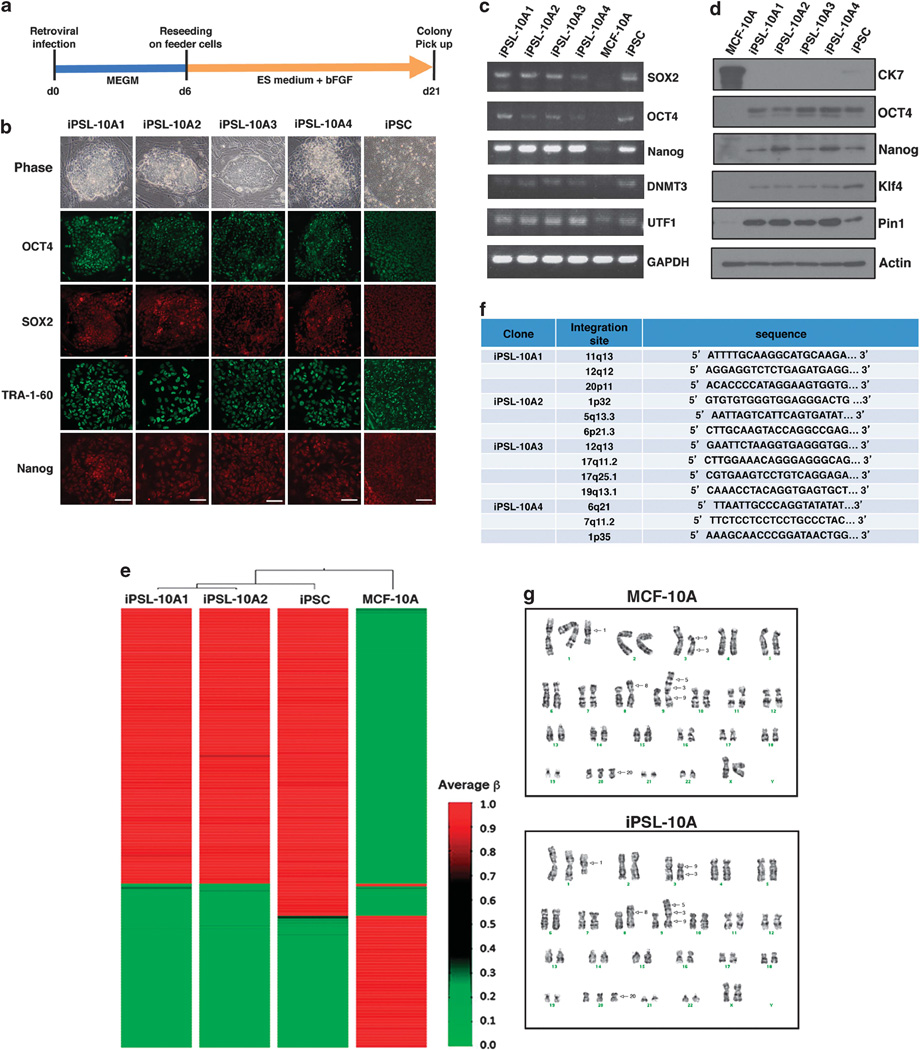
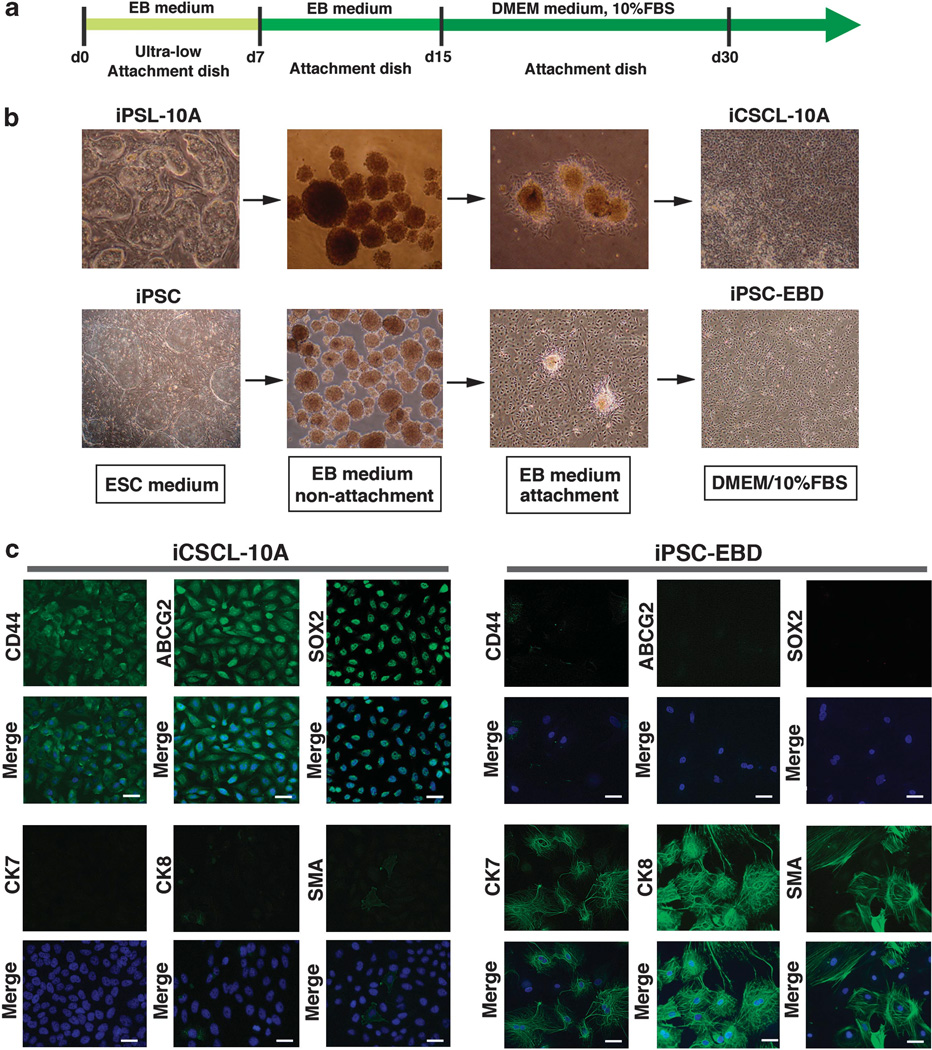
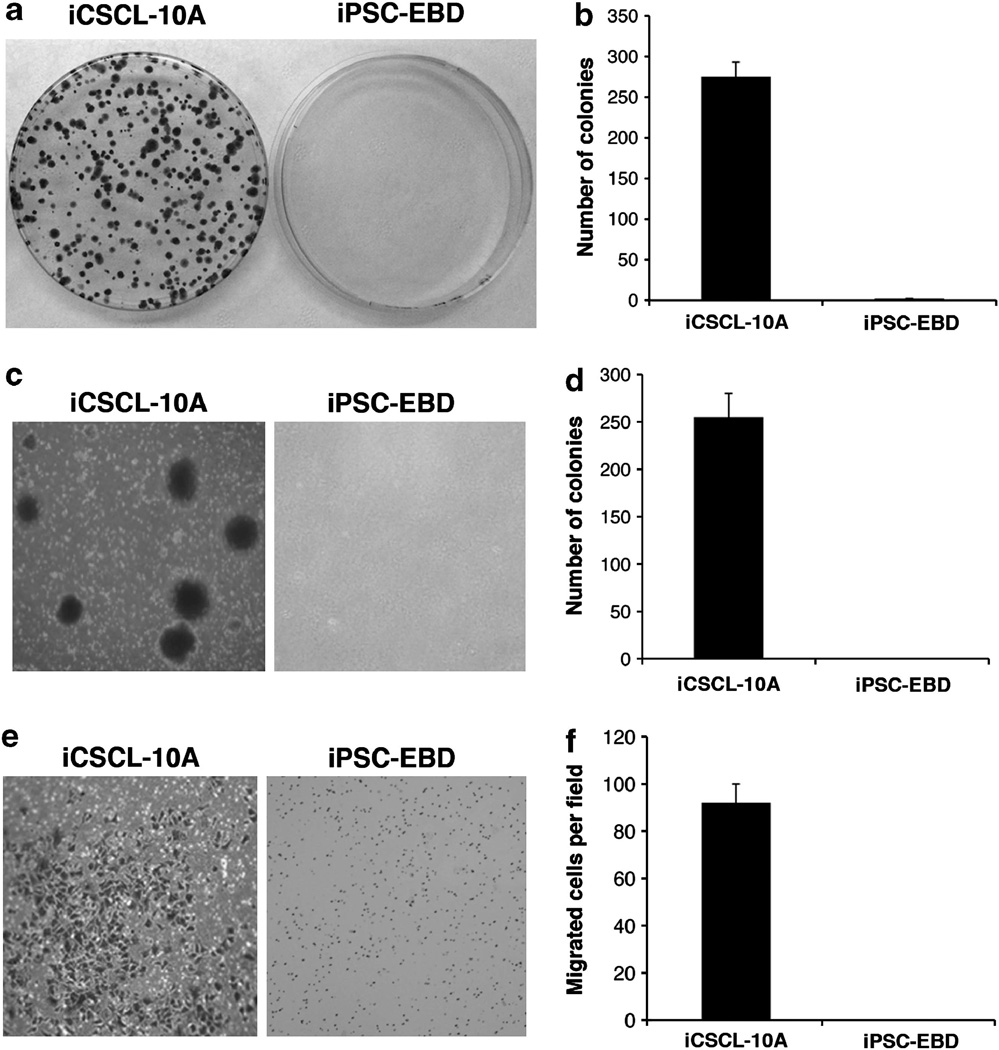
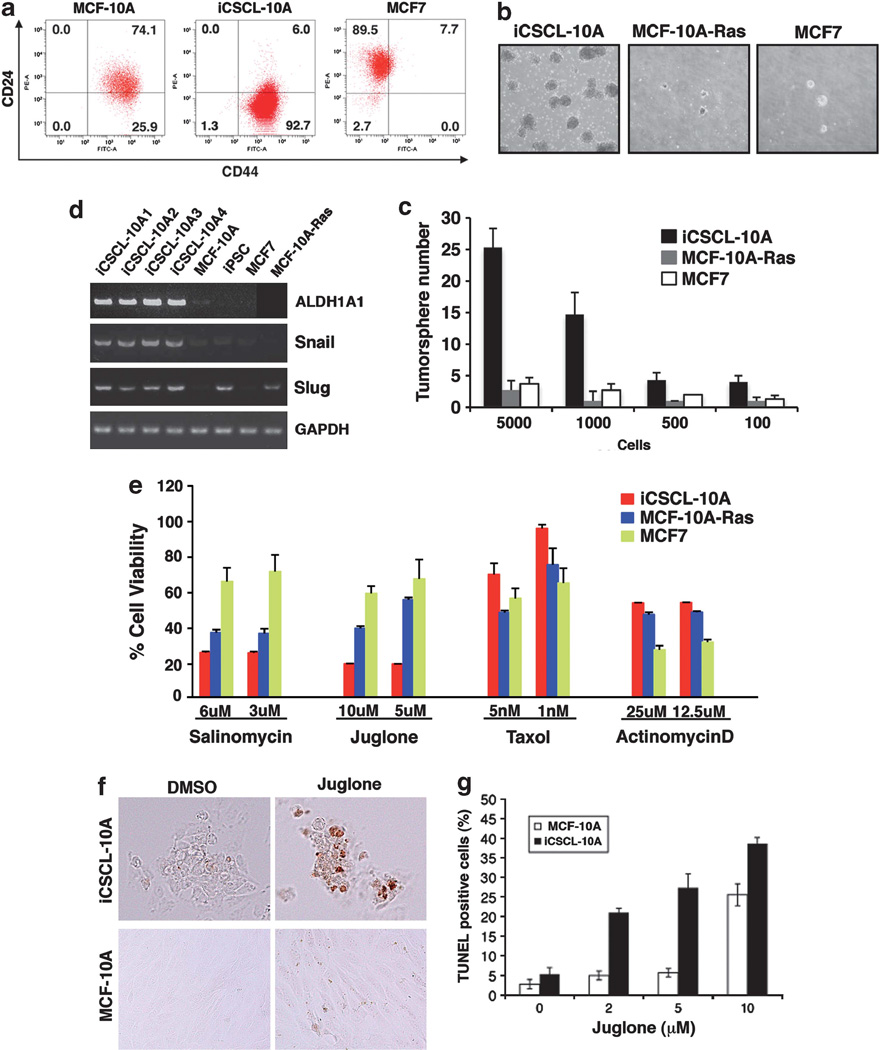
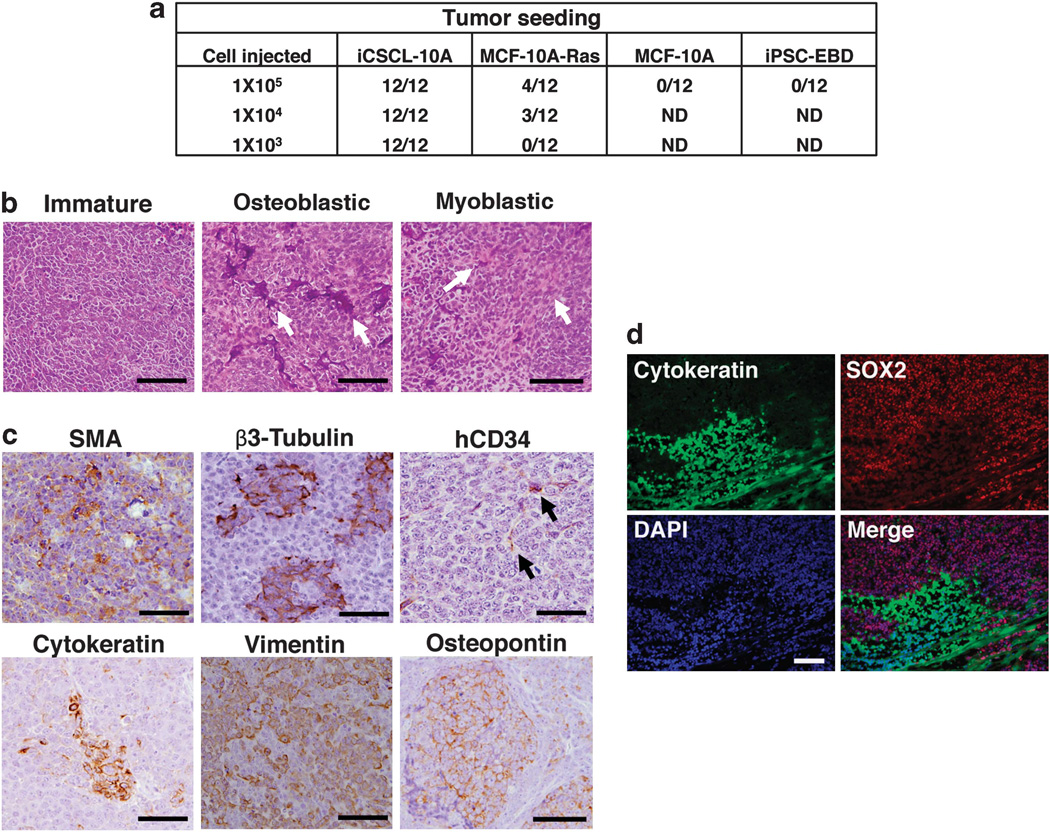
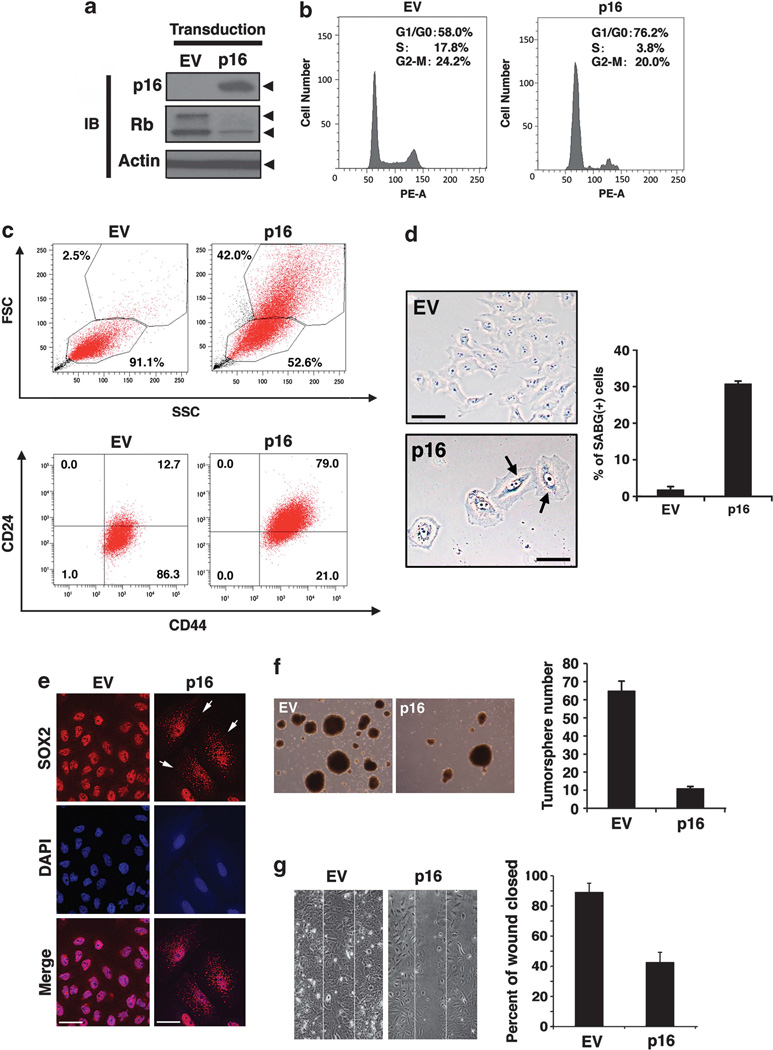
Cancer stem cells (CSCs), a small and elusive population of undifferentiated cancer cells within tumors that drive tumor growth and recurrence, are believed to resemble normal stem cells. Although surrogate markers have been identified and compelling CSC theoretical models abound, actual proof for the existence of CSCs can only be had retrospectively. Hence, great store has come to be placed in isolating CSCs from cancers for in-depth analysis. On the other hand, although induced pluripotent stem cells (iPSCs) hold great promise for regenerative medicine, concern exists over the inadvertent co-transplantation of partially or undifferentiated stem cells with tumorigenic capacity. Here we demonstrate that the introduction of defined reprogramming factors (OCT4, SOX2, Klf4 and c-Myc) into MCF-10A nontumorigenic mammary epithelial cells, followed by partial differentiation, transforms the bulk of cells into tumorigenic CD44(+)/CD24(low) cells with CSC properties, termed here as induced CSC-like-10A or iCSCL-10A cells. These reprogrammed cells display a malignant phenotype in culture and form tumors of multiple lineages when injected into immunocompromised mice. Compared with other transformed cell lines, cultured iCSCL-10A cells exhibit increased resistance to the chemotherapeutic compounds, Taxol and Actinomycin D, but higher susceptibility to the CSC-selective agent Salinomycin and the Pin1 inhibitor Juglone. Restored expression of the cyclin-dependent kinase inhibitor p16INK4a abrogated the CSC properties of iCSCL-10A cells, by inducing cellular senescence. This study provides some insight into the potential oncogenicity that may arise via cellular reprogramming, and could represent a valuable in vitro model for studying the phenotypic traits of CSCs per se.


Conflict of interest statement

CONFLICT OF INTEREST

The authors declare no conflict of interest.

Figures

Figure 1
Figure 1
Reprogramming of human MCF-10A mammary epithelial cells. (a) Experimental scheme for the reprogramming of MCF-10A cells. (b) Phase-contrast images and immunofluorescence images of iPS-like colonies from MCF-10A cells (iPSL-10A) and normal human iPSCs stained with antibodies against OCT4, SOX2, TRA-1-60 and Nanog. Scale bar, 500 µm. (c) Semiquantitative reverse transcriptase–PCR (RT–PCR) analysis of iPSC markers in iPSL-10A cell clones 1–4, normal human iPSCs and MCF-10A cells. SOX2 and OCT4 are endogenously derived. (d) Immunoblotting of the stem cell marker proteins in iPSL-10A cell clones 1–4, normal human iPSCs and MCF-10A cells. (e) DNA methylation ‘heat map’ of iPSL-10A cells. DNA methylation analysis was performed using an Illumina Human Methylation 27 Beads Chip (MBL) with genomic DNA extracted from iPSL-10A clones 1 and 2, normal human iPSCs and MCF-10A cells. The β-value was calculated by a quantitative measure of the DNA methylation levels at specific CpG islands. Average β-values were subjected to unsupervised hierarchical clustering based on the Manhattan distance and average linkage. (f) High-resolution insertion-site analysis by linear amplification-mediated PCR (LAM PCR). Genomic DNA was prepared using phenol/chloroform extraction and subjected to LAM PCR. Amplicons were validated by sequencing. (g) Standard G-band chromosome analysis of MCF-10A and iPSL-10A cells. Arrows indicate identifiable aberrations common to both cell types.
Figure 2
Figure 2
In vitro differentiation of iPSL-10A cells into induced CSCs. (a) Schematic representation of the in vitro differentiation of iPSL-10A and normal iPSCs. (b) Representative phase-contrast images of either iPSL-10A or normal iPSCs during embryoid body (EB)-mediated differentiation. After EBs were transferred onto gelatin-coated attachment plates and allowed to further differentiate for 8 days. These cells were then finally cultured in DMEM/10% FBS up to day 30. (c) Immunofluorescent analysis of lineage marker proteins in cultured iCSCL-10A and iPSC-EBD cells. Nuclei were counterstained with 4′,6-diamidino-2-phenylindole (DAPI). Scale bar, 200 µm.
Figure 3
Figure 3
Malignant phenotypes of iCSCL-10A in vitro. (a, b) Focus formation assay of iCSCL-10A and iPSC-EBD cells. Equal numbers of cells (5 × 10²) were seeded onto 10 cm plastic dishes. After 10 days, the cells were fixed and stained with crystal violet (a). The numbers of colonies were calculated and scored (mean ± s.d.) from three independent experiments (b). (c, d) iCSCL-10A and iPSC-EBD cells were plated in 0.3% soft agar and cultured for 2 weeks. Representative microscopic fields are presented (c). Colony formation was scored microscopically and the colony numbers (mean ± s.d.) were calculated from three independent experiments (d). (e, f) Cell invasion assays were performed using chemotaxis chambers in transwell tissue culture dishes as described in the Materials and methods. Representative microscopic fields are shown (e). Invasive cells were counted and scored in triplicate. The mean values ± s.d. were calculated from three independent experiments (f).
Figure 4
Figure 4
Characterization of the CSC properties of iCSCL-10A clones. (a) Flow cytometric analysis of CD44 and CD24 expression in the MCF-10A, iCSCL-10A and MCF7 cell lines. The numbers indicate the percentage of each sub-population according to the CD44/CD24 expression profile. (b, c) Tumor sphere formation assays of MCF-10A-Ras, iCSCL-10A and MCF7 cell lines. Phase-contrast images of tumor spheres are shown (b). Values represent the mean ± s.e.m. (n=3, c). (d) Semiquantitative reverse transcriptase–PCR (RT–PCR) analysis of the expression of CSC- or epithelial-to-mesenchymal transition (EMT)-related genes. Glyceraldehyde-3-phosphate dehydrogenase (GAPDH) was analyzed as a control. (e) Viability of MCF-10A-Ras, iCSCL-10A and MCF7 cell lines treated with various chemotherapeutic agents for 72 h by MTT assay. Values represent the mean ± s.e.m. (n=3). (f, g) iCSCL-10A and parental MCF-10A cells were treated with Juglone (5 µm) for 24 h and subjected to TUNEL (terminal deoxyribonucleotidyl transferase-mediated dUTP nick end-labeling) assay (f, brown color). TUNEL-positive cells were scored from triplicate independent experiments (g). Values represent the mean ± s.e.m. (n=3).
Figure 5
Figure 5
iCSCL-10A cells form hierarchically organized tumors in vivo. (a) Tumor-seeding ability of iCSCL-10A, MCF-10A-Ras parental MCF-10A cells and iPSC-EBD. The indicated numbers of each cell type were injected into immunocompromised mice. The tumor-initiation ability per injection was then monitored. (b) Hematoxylin and eosin (H&E) staining of primary tumor tissues. Scale bar, 500 µm. (c) Immunohistochemical analysis of primary tumor tissues derived from iCSCL-10A cells using antibodies targeting hCD34 (endothelial), smooth muscle actin (SMA; myoblastic), β3-tubulin (neural), cytokeratin (CAM5.2, epithelial), vimentin (mesenchymal) and osteopontin (osteoblastic). Scale bar, 500 µm. (d) Immunofluorescent analysis with antibodies targeting SOX2 and cytokeratin (AE1/AE3). Nuclei were counterstained with 4′,6-diamidino-2-phenylindole (DAPI). Scale bar, 500 µm.
Figure 6
Figure 6
Cyclin-dependent kinase inhibitor p16 suppresses the CSC properties of iCSCL-10A cells and induces cellular senescence. (a) Immunoblotting analysis of p16 and Rb in iCSCL-10A cells transduced with the p16 vector or with an empty vector (EV) control retrovirus. Actin was used as a loading control. (b) Flow cytometric analysis of the cell cycle status following propidium iodide (PI) staining of iCSCL-10A cells transduced with p16 or EV. (c) Flow cytometric analysis of forward scatter (FSC) versus side scatter (SSC) dot plot (upper panels) and CD44/CD24 expression (lower panels). Note that p16 transduction results in the appearance of large-sized cells. (d) p16-transduced iCSCL-10A cells were subjected to senescence-associated β-galactosidase staining (SABG). Phase-contrast images of the cells are shown. Arrows indicate positive signals shown in blue (photomicrographs). Scale bar, 200 µm. Bars indicate the percentage of SABG-positive cells for each cell species (histogram). Values represent the mean ± s.e.m. (n=3). (e) Re-expression of p16 promotes SOX2 translocation from the nucleus to the cytoplasm. Immunofluorescent analysis of SOX2 in p16-transduced iCSCL-10A cells. Arrows indicate cytoplasmic localization of SOX2. Nuclei were counterstained with 4′,6-diamidino-2-phenylindole (DAPI). (f) p16 transduction abrogates the tumor sphere-forming ability of iCSCL-10A cells. Phase-contrast images of tumor spheres transduced with p16 or EV and quantification of tumor sphere formation. Values represent the means ± s.e.m. (n=3). (g) Effects of p16 on wound healing. Confluent monolayers of the iCSCL-10A cells transduced with either p16 or EV were mechanically wounded using the tip of a pipette. After 6 h, the cells were fixed and images were captured. Wound closures were scored using ImageJ software. Values represent the mean ± s.e.m. (n=3).

References

    1. Visvader JE, Lindeman GJ. Cancer stem cells in solid tumours: accumulating evidence and unresolved questions. Nat Rev Cancer. 2008;8:755–768. - PubMed
    1. Al-Hajj M, Wicha MS, Benito-Hernandez A, Morrison SJ, Clarke MF. Prospective identification of tumorigenic breast cancer cells. Proc Natl Acad Sci USA. 2003;100:3983–3988. - PMC - PubMed
    1. Singh SK, Clarke ID, Terasaki M, Bonn VE, Hawkins C, Squire J, et al. Identification of a cancer stem cell in human brain tumors. Cancer Res. 2003;63:5821–5828. - PubMed
    1. Clevers H. The cancer stem cell: premises, promises and challenges. Nat Med. 2011;17:313–319. - PubMed
    1. Dean M, Fojo T, Bates S. Tumour stem cells and drug resistance. Nat Rev Cancer. 2005;5:275–284. - PubMed

Publication types

MeSH terms