

NG2-cells are not the cell of origin for murine neurofibromatosis-1 (Nf1) optic glioma
- PMID: 23318450
- PMCID: PMC3874418
- DOI: 10.1038/onc.2012.580
NG2-cells are not the cell of origin for murine neurofibromatosis-1 (Nf1) optic glioma
Abstract
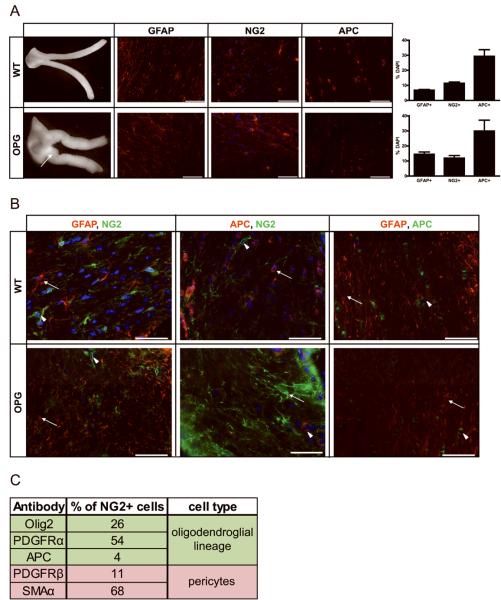
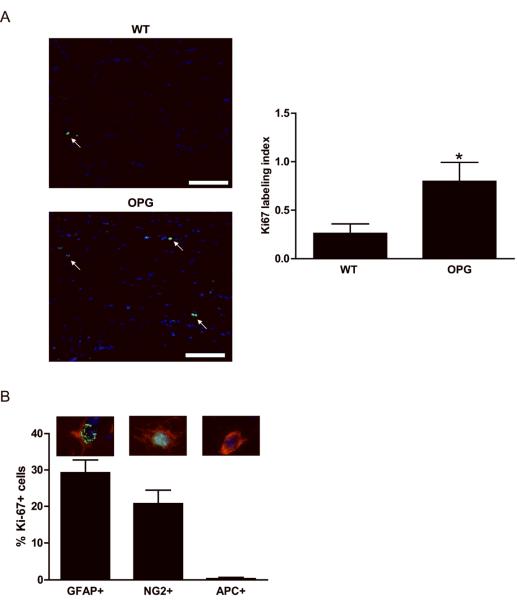
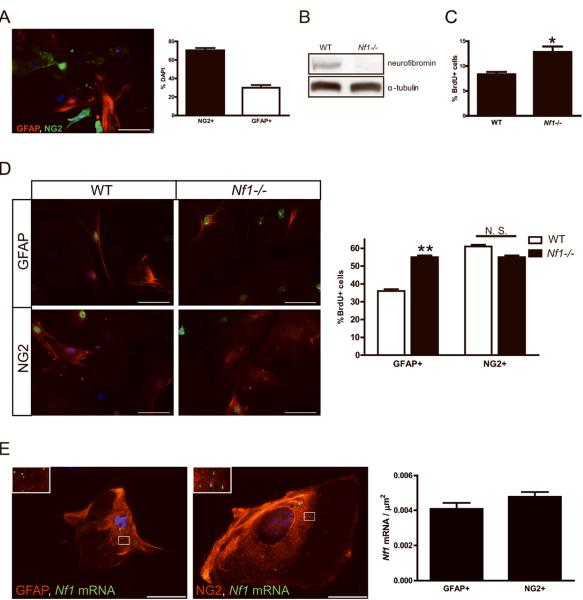
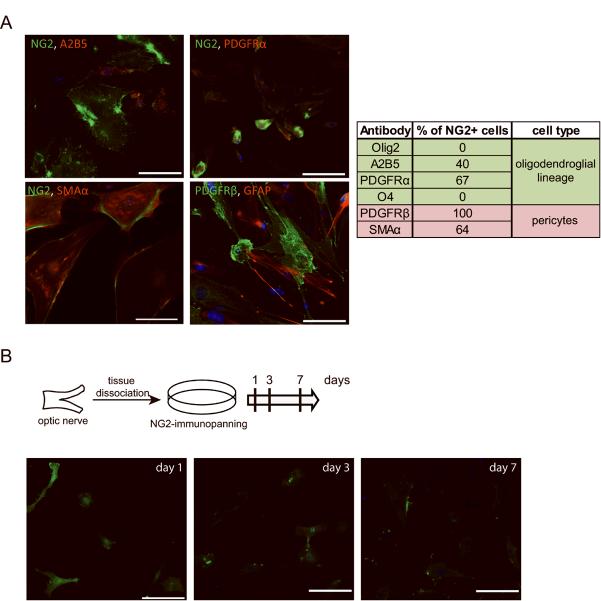
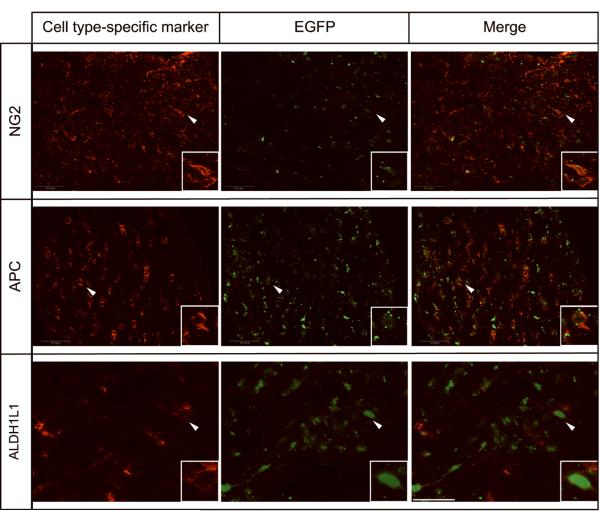
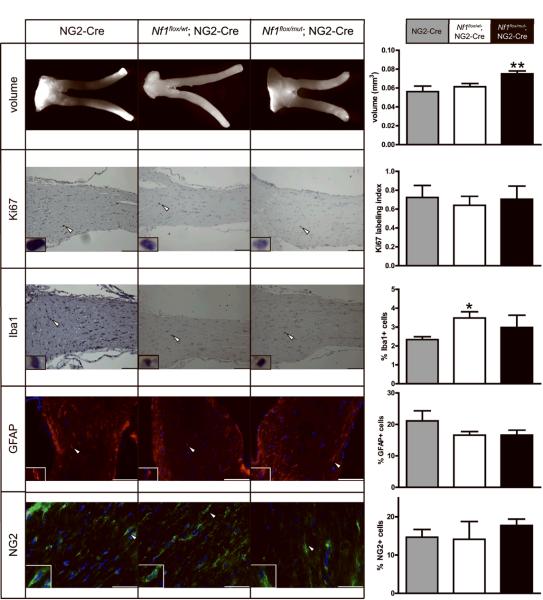
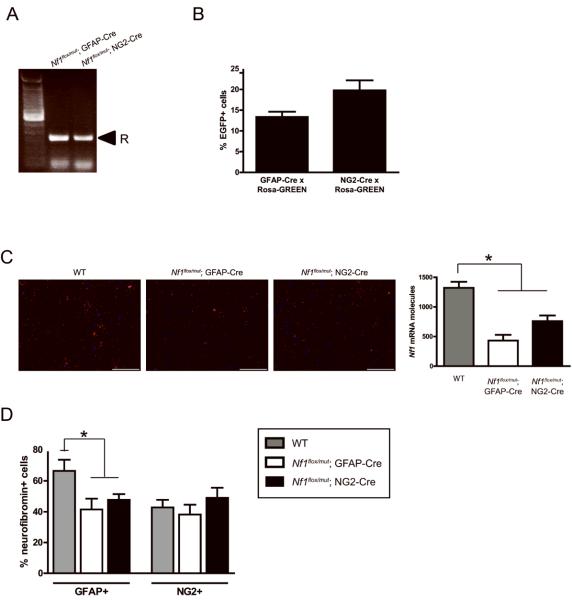
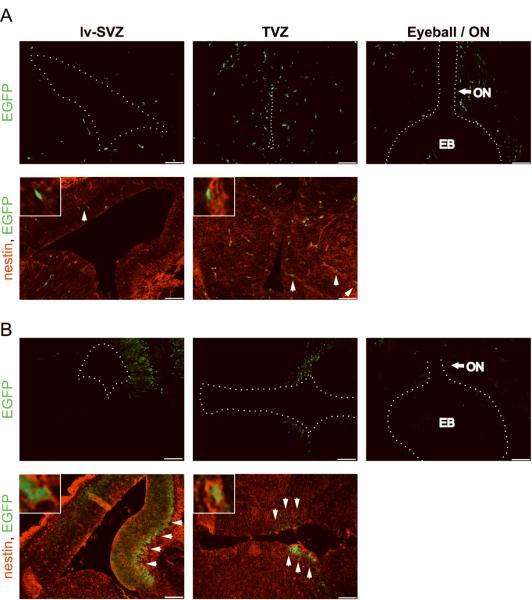
Low-grade glial neoplasms (astrocytomas) represent one of the most common brain tumors in the pediatric population. These tumors frequently form in the optic pathway (optic pathway gliomas, OPGs), especially in children with the neurofibromatosis type 1 (NF1)-inherited tumor predisposition syndrome. To model these tumors in mice, we have previously developed several Nf1 genetically-engineered mouse strains that form optic gliomas. However, there are three distinct macroglial cell populations in the optic nerve (astrocytes, NG2+ (nerve/glial antigen 2) cells and oligodendrocytes). The presence of NG2+ cells in the optic nerve raises the intriguing possibility that these cells could be the tumor-initiating cells, as has been suggested for adult glioma. In this report, we used a combination of complementary in vitro and novel genetically-engineered mouse strains in vivo to determine whether NG2+ cells could give rise to Nf1 optic glioma. First, we show that Nf1 inactivation results in a cell-autonomous increase in glial fibrillary acidic protein+ (GFAP+), but not in NG2+, cell proliferation in vitro. Second, similar to the GFAP-Cre transgenic strain that drives Nf1 optic gliomagenesis, NG2-expressing cells also give rise to all three macroglial lineages in vivo. Third, in contrast to the GFAP-Cre strain, Nf1 gene inactivation in NG2+ cells is not sufficient for optic gliomagenesis in vivo. Collectively, these data demonstrate that NG2+ cells are not the cell of origin for mouse optic glioma, and support a model in which gliomagenesis requires Nf1 loss in specific neuroglial progenitors during embryogenesis.
Figures
Similar articles
-
The cell of origin dictates the temporal course of neurofibromatosis-1 (Nf1) low-grade glioma formation.Oncotarget. 2017 Jul 18;8(29):47206-47215. doi: 10.18632/oncotarget.17589. Oncotarget. 2017. PMID: 28525381 Free PMC article.
-
NF1 germline mutation differentially dictates optic glioma formation and growth in neurofibromatosis-1.Hum Mol Genet. 2016 May 1;25(9):1703-13. doi: 10.1093/hmg/ddw039. Epub 2016 Feb 16. Hum Mol Genet. 2016. PMID: 26908603 Free PMC article.
-
Inactivation of NF1 in CNS causes increased glial progenitor proliferation and optic glioma formation.Development. 2005 Dec;132(24):5577-88. doi: 10.1242/dev.02162. Development. 2005. PMID: 16314489 Free PMC article.
-
Insights into optic pathway glioma vision loss from mouse models of neurofibromatosis type 1.J Neurosci Res. 2019 Jan;97(1):45-56. doi: 10.1002/jnr.24250. Epub 2018 Apr 28. J Neurosci Res. 2019. PMID: 29704429 Free PMC article. Review.
-
An Overview of Optic Pathway Glioma With Neurofibromatosis Type 1: Pathogenesis, Risk Factors, and Therapeutic Strategies.Invest Ophthalmol Vis Sci. 2024 Jun 3;65(6):8. doi: 10.1167/iovs.65.6.8. Invest Ophthalmol Vis Sci. 2024. PMID: 38837168 Free PMC article. Review.
Cited by
-
Akt- or MEK-mediated mTOR inhibition suppresses Nf1 optic glioma growth.Neuro Oncol. 2015 Jun;17(6):843-53. doi: 10.1093/neuonc/nou329. Epub 2014 Dec 21. Neuro Oncol. 2015. PMID: 25534823 Free PMC article.
-
Temporal, spatial, and genetic constraints contribute to the patterning and penetrance of murine neurofibromatosis-1 optic glioma.Neuro Oncol. 2021 Apr 12;23(4):625-637. doi: 10.1093/neuonc/noaa237. Neuro Oncol. 2021. PMID: 33080011 Free PMC article.
-
The Neuroimmune Regulation and Potential Therapeutic Strategies of Optic Pathway Glioma.Brain Sci. 2023 Oct 7;13(10):1424. doi: 10.3390/brainsci13101424. Brain Sci. 2023. PMID: 37891793 Free PMC article. Review.
-
The cell of origin dictates the temporal course of neurofibromatosis-1 (Nf1) low-grade glioma formation.Oncotarget. 2017 Jul 18;8(29):47206-47215. doi: 10.18632/oncotarget.17589. Oncotarget. 2017. PMID: 28525381 Free PMC article.
-
Pediatric low-grade glioma models: advances and ongoing challenges.Front Oncol. 2024 Jan 22;13:1346949. doi: 10.3389/fonc.2023.1346949. eCollection 2023. Front Oncol. 2024. PMID: 38318325 Free PMC article. Review.
References
-
- Blazo MA, Lewis RA, Chintagumpala MM, Frazier M, McCluggage C, Plon SE. Outcomes of systematic screening for optic pathway tumors in children with Neurofibromatosis Type 1. Am J Med Genet A. 2004 Jun 15;127A(3):224–9. - PubMed
-
- Lund AM, Skovby F. Optic gliomas in children with neurofibromatosis type 1. Eur J Pediatr. 1991 Oct;150(12):835–8. - PubMed
-
- Listernick R, Darling C, Greenwald M, Strauss L, Charrow J. Optic pathway tumors in children: the effect of neurofibromatosis type 1 on clinical manifestations and natural history. J Pediatr. 1995 Nov;127(5):718–22. - PubMed
-
- Czyzyk E, Jozwiak S, Roszkowski M, Schwartz RA. Optic pathway gliomas in children with and without neurofibromatosis 1. J Child Neurol. 2003 Jul;18(7):471–8. - PubMed
-
- Listernick R, Louis DN, Packer RJ, Gutmann DH. Optic pathway gliomas in children with neurofibromatosis 1: consensus statement from the NF1 Optic Pathway Glioma Task Force. Ann Neurol. 1997 Feb;41(2):143–9. - PubMed
Publication types
MeSH terms
Substances
Grants and funding
LinkOut - more resources
Full Text Sources
Other Literature Sources
Medical
Molecular Biology Databases
Research Materials
Miscellaneous
