

Changes in water and beverage intake and long-term weight changes: results from three prospective cohort studies
- PMID: 23318721
- PMCID: PMC3628978
- DOI: 10.1038/ijo.2012.225
Changes in water and beverage intake and long-term weight changes: results from three prospective cohort studies
Abstract
Objective: To examine the long-term relationship between changes in water and beverage intake and weight change.
Subjects: Prospective cohort studies of 50013 women aged 40-64 years in the Nurses' Health Study (NHS, 1986-2006), 52987 women aged 27-44 years in the NHS II (1991-2007) and 21988 men aged 40-64 years in the Health Professionals Follow-up Study (1986-2006) without obesity and chronic diseases at baseline.
Measures: We assessed the association of weight change within each 4-year interval, with changes in beverage intakes and other lifestyle behaviors during the same period. Multivariate linear regression with robust variance and accounting for within-person repeated measures were used to evaluate the association. Results across the three cohorts were pooled by an inverse-variance-weighted meta-analysis.
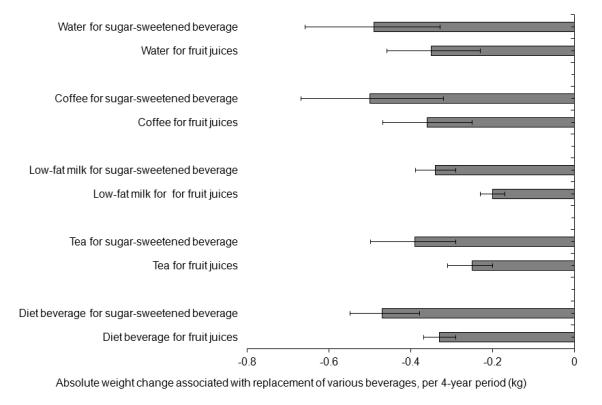
Results: Participants gained an average of 1.45 kg (5th to 95th percentile: -1.87 to 5.46) within each 4-year period. After controlling for age, baseline body mass index and changes in other lifestyle behaviors (diet, smoking habits, exercise, alcohol, sleep duration, TV watching), each 1 cup per day increment of water intake was inversely associated with weight gain within each 4-year period (-0.13 kg; 95% confidence interval (CI): -0.17 to -0.08). The associations for other beverages were: sugar-sweetened beverages (SSBs) (0.36 kg; 95% CI: 0.24-0.48), fruit juice (0.22 kg; 95% CI: 0.15-0.28), coffee (-0.14 kg; 95% CI: -0.19 to -0.09), tea (-0.03 kg; 95% CI: -0.05 to -0.01), diet beverages (-0.10 kg; 95% CI: -0.14 to -0.06), low-fat milk (0.02 kg; 95% CI: -0.04 to 0.09) and whole milk (0.02 kg; 95% CI: -0.06 to 0.10). We estimated that replacement of 1 serving per day of SSBs by 1 cup per day of water was associated with 0.49 kg (95% CI: 0.32-0.65) less weight gain over each 4-year period, and the replacement estimate of fruit juices by water was 0.35 kg (95% CI: 0.23-0.46). Substitution of SSBs or fruit juices by other beverages (coffee, tea, diet beverages, low-fat and whole milk) were all significantly and inversely associated with weight gain.
Conclusion: Our results suggest that increasing water intake in place of SSBs or fruit juices is associated with lower long-term weight gain.
Figures
References
-
- Wolf A, Bray GA, Popkin BM. A short history of beverages and how our body treats them. Obes Rev. 2008;9(2):151–164. - PubMed
-
- Nielsen SJ, Popkin BM. Changes in beverage intake between 1977 and 2001. Am J Prev Med. 2004;27:205–210. - PubMed
-
- Bleich SN, Wang YC, Wang Y, Gortmaker SL. Increasing consumption of sugar-sweetened beverages among US adults: 1988-1994 to 1999-2004. Am J Clin Nutr. 2009;89:372–381. - PubMed
-
- Olsen NJ, Heitmann BL. Intake of calorically sweetened beverages and obesity. Obes Rev. 2009;10:68–75. - PubMed
Publication types
MeSH terms
Substances
Grants and funding
- R01 CA050385/CA/NCI NIH HHS/United States
- R01 DK058845/DK/NIDDK NIH HHS/United States
- P01CA087969/CA/NCI NIH HHS/United States
- U19 CA055075/CA/NCI NIH HHS/United States
- P30 DK046200/DK/NIDDK NIH HHS/United States
- U54 CA155626/CA/NCI NIH HHS/United States
- R01DK058845/DK/NIDDK NIH HHS/United States
- T32 DK007703/DK/NIDDK NIH HHS/United States
- U19CA055075/CA/NCI NIH HHS/United States
- U54CA155626/CA/NCI NIH HHS/United States
- R01CA050385/CA/NCI NIH HHS/United States
- P01 CA087969/CA/NCI NIH HHS/United States
- P30DK046200/DK/NIDDK NIH HHS/United States
- R01 HL060712/HL/NHLBI NIH HHS/United States
LinkOut - more resources
Full Text Sources
Other Literature Sources
Medical
