. 2013 Jun:54:297-307.
doi: 10.1016/j.nbd.2012.12.021. Epub 2013 Jan 11.

Focal Scn1a knockdown induces cognitive impairment without seizures

Affiliations

Focal Scn1a knockdown induces cognitive impairment without seizures

Alex C Bender et al. Neurobiol Dis. 2013 Jun.

Abstract

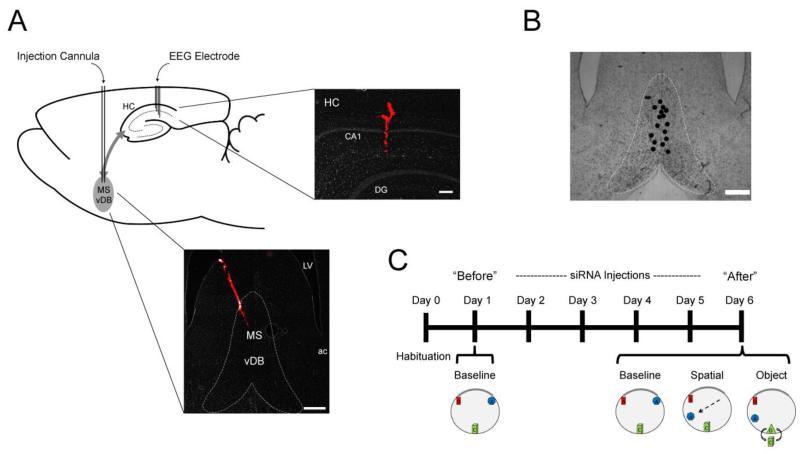
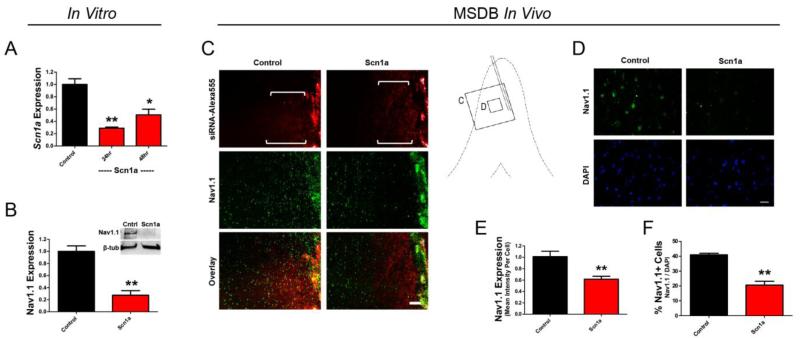
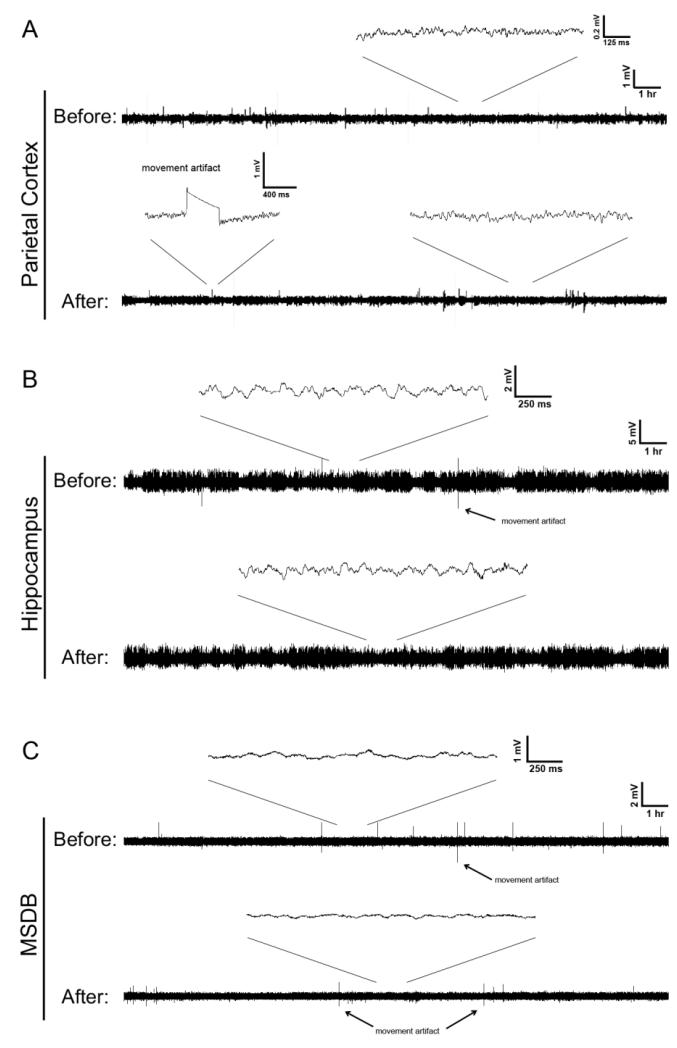
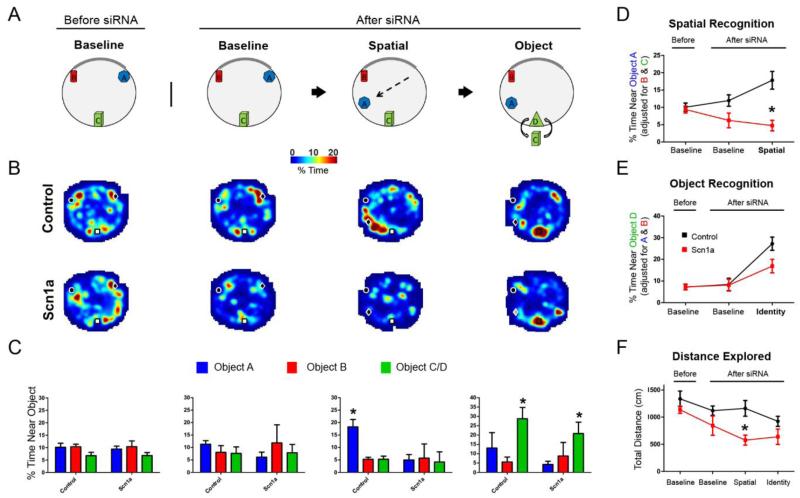
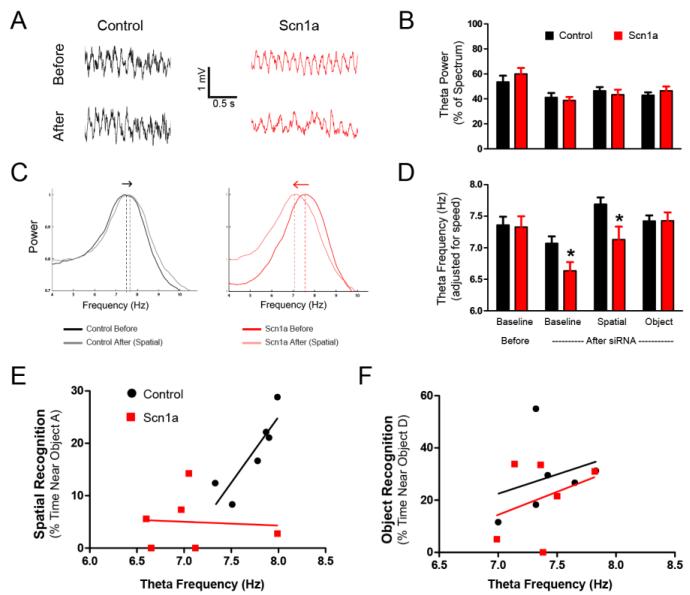
Cognitive impairment is a common comorbidity in pediatric epilepsy that can severely affect quality of life. In many cases, antiepileptic treatments fail to improve cognition. Therefore, a fundamental question is whether underlying brain abnormalities may contribute to cognitive impairment through mechanisms independent of seizures. Here, we examined the possible effects on cognition of Nav1.1 down-regulation, a sodium channel principally involved in Dravet syndrome but also implicated in other cognitive disorders, including autism and Alzheimer's disease. Using an siRNA approach to knockdown Nav1.1 selectively in the basal forebrain region, we were able to target a learning and memory network while avoiding the generation of spontaneous seizures. We show that reduction of Nav1.1 expression in the medial septum and diagonal band of Broca leads to a dysregulation of hippocampal oscillations in association with a spatial memory deficit. We propose that the underlying etiology responsible for Dravet syndrome may directly contribute to cognitive impairment in a manner that is independent from seizures.


Figures

Figure 1
Figure 1
Experimental design. (A) A guide cannula for siRNA injection was implanted into the MSDB and a custom EEG recording electrode was implanted into the CA1 region of the dorsal hippocampus. Insets show locations of injection and recording sites in coronal view from a cannula (lower) and electrode (upper) that were coated in DiI prior to implantation. Scale bars equal 500 μm (lower) and 200 μm (upper). (B) Accuracy of cannula placement. Black dots show locations of injection sites from 16 rats implanted during the course of the study. Scale bar equals 500 μm. (C) Timeline: Adult rats were injected with negative control- or Scn1a-targeted siRNA complexes over 4 days (Days 2-5) and then tested in a reaction-to-novelty task (Day 6). The “Baseline” session was performed on Day 1 and repeated on Day 6 (also see Methods). MS, medial septum; vDB, vertical limb of the diagonal band of Broca; LV, lateral ventrical; ac, anterior commissure; HC, hippocampus; CA1, field CA1 of hippocampus; DG, dentate gyrus.
Figure 2
Figure 2
siRNA-induced knockdown of Nav1.1 expression. (A) Scn1a-siRNA constructs reduced Scn1a expression by 71% and 49% after 24 and 48 hours, respectively, in cultured rat neuroblastoma cells (*p<.05, **p<.01). Levels are expressed normalized to GAPDH. (B) Nav1.1 protein expression was similarly reduced by 73% after 48 hours (**p<.01). Inset shows representative WB. (C) Nav1.1 expression was assessed after 4 days injection of Alexa555-conjugated control- or Scn1a-siRNA complexes by immunofluorescence. Example shows reduced Nav1.1 immunofluorescence in the Scn1a-siRNA group in the transfected region indicated by white brackets (identified by Alexa555 fluorescence). Artifact from the track of the cannula can be seen on the right side of the images. Scale bar equals 100 μm. (D) Examples of images taken at higher magnification revealing reduced Nav1.1 staining after Scn1a-siRNA injections. Scale bar equals 20 um. (E) In the transfected region, the mean fluorescent intensity for Nav1.1 immunoreactive cells was reduced by 39% (**p<.01), and (F) the proportion of Nav1.1 immunoreactive cells (compared to DAPI) was decreased by 49% (**p<.01). Error bars represent standard error of the mean.
Figure 3
Figure 3
Continuous EEG monitoring. Examples of 24 hr epochs of EEG recorded before and after Scn1a-siRNA administration. Each pair of a “Before” and “After” epoch is taken from the same animal. (A) In one group (n=4), EEG was recorded from the cortical surface. (B-C) In a second group (n=4), intracranial EEG recordings were used to monitor local activity bilaterally in the hippocampus (B) and in the MSDB (C). Continuous EEG monitoring was performed for a minimum of 24 hrs before and 24 hrs again after siRNA treatment. Insets show examples on shorter time scales of representative EEG signal and movement artifact. These artifacts occurred both before and after siRNA treatment in roughly equal proportion. No behavioral or electroencephalographic seizures were observed after siRNA treatment.
Figure 4
Figure 4
Knockdown of Nav1.1 in the MSDB impairs spatial memory. (A) Exploratory behavior was assessed in four sessions. Before siRNA injections (Day 1), rats were exposed to a “baseline” configuration of 3 objects. Then, after siRNA injections (Day 6) the rats were re-exposed to the same baseline session followed by a novel spatial session (object “A” was moved to a new location), and a novel object session (object “C” was replaced with object “D” in the same location). The response to spatial change, but not object change, was impaired in Scn1a-siRNA treated rats. (B) Mean exploration time for each group. Scale is expressed in percent time. (C) Mean percent time near each object. (D) Using generalized estimating equations to compare the pattern of the responses over time, the response of the controls, but not Scn1a-siRNA treated rats, to object A was significantly greater during the spatial session than during the prior baseline sessions, and this response was significantly different between groups (GEE: session × group, p<.01, n=6 per group). (E) In contrast, the responses to object “D” during the novel object recognition session were not significantly different between groups (group, p>.05; session × group p>.05, n=6 per group); both groups explored object “D” significantly more during the object identity session compared to prior sessions (session, p<.001, n=6 per group). (F) The total distance travelled was measured and a two-way repeated measures ANOVA with Bonferroni multiple comparisons was used to test for significance. Exploration was not significantly different between groups during either baseline sessions before or after siRNA treatment (p>.05). In agreement with panels B-E, exploration in controls was significantly greater than the Scn1a-treated rats during the spatial session (F(1,10)=9.83, effect by group, p<.05, Bonferroni post test for spatial, t=3.36, p<.01) but not significantly different during the novel object session (p>.05). Error bars represent standard error of the mean. *denotes significance by GEE.
Figure 5
Figure 5
Knockdown of Nav1.1 in the MSDB alters hippocampal theta frequency. Hippocampal EEG recordings were performed simultaneously with behavioral testing. (A) Examples of EEGs recorded before and after siRNA injections. (B) No difference in hippocampal theta power was observed between groups (GEE: p>.05, n=6 per group, adjusted for speed). (C) Examples of EEG spectrograms from before and after siRNA administration recorded during periods of motion. Power is normalized to the peak of theta to show changes in frequency. A shift in theta frequency was observed, with controls increased during the spatial task and the Scn1a-siRNA rats decreased from Day 1. (D) Generalized estimating equations was used to compare changes in theta frequency with speed as a covariate. After siRNA administration, theta frequency was altered in Scn1a-siRNA treated rats (GEE: group × session, p<.001, n=6 per group). Scn1a-siRNA treated rats exhibited reduced theta frequency compared to controls during the post-exposure baseline and spatial sessions. Theta frequency values are shown adjusted for speed. Error bars represent standard error of the mean. *denotes significance by GEE. (E) Theta frequency is shown plotted versus percent time spent near object A during the post-treatment spatial session for each individual rat. Linear regression revealed a significant relationship between theta frequency and spatial performance in the controls (R2=0.76, p<.05) that was absent in the Scn1a-siRNA treated group (R2=.005, p>.05). (F) Theta frequency plotted versus percent time spent near object D during the post-treatment novel object session. No relationship was found in either group (p>.05).

Similar articles

Cited by

References

    1. Akiyama M, Kobayashi K, Yoshinaga H, Ohtsuka Y. A long-term follow-up study of Dravet syndrome up to adulthood. Epilepsia. 2010;51:1043–1052. - PubMed
    1. Ben-ari Y, Holmes GL. Effects of seizures on developmental processes in the immature brain. Lancet Neurology. 2006;5:1055–1063. - PubMed
    1. Bender AC, Morse RP, Scott RC, Holmes GL, Lenck-Santini P-P. SCN1A mutations in Dravet syndrome: Impact of interneuron dysfunction on neural networks and cognitive outcome. Epilepsy & Behavior. 2012;23:177–186. - PMC - PubMed
    1. Bland BH, Oddie SD. Theta band oscillation and synchrony in the hippocampal formation and associated structures: the case for its role in sensorimotor integration. Behavioural Brain Research. 2001;127:119–136. - PubMed
    1. Bragin A, Azizyan A, Almajano J, Engel J. The cause of the imbalance in the neuronal network leading to seizure activity can be predicted by the electrographic pattern of the seizure onset. The Journal of Neuroscience. 2009;29:3660–3671. - PMC - PubMed

Publication types

MeSH terms

Substances