. 2013 Jul 1;535(1):49-55.
doi: 10.1016/j.abb.2012.12.021. Epub 2013 Jan 11.

Myofilament incorporation and contractile function after gene transfer of cardiac troponin I Ser43/45Ala

Affiliations

Myofilament incorporation and contractile function after gene transfer of cardiac troponin I Ser43/45Ala

Sarah E Lang et al. Arch Biochem Biophys. .

Abstract

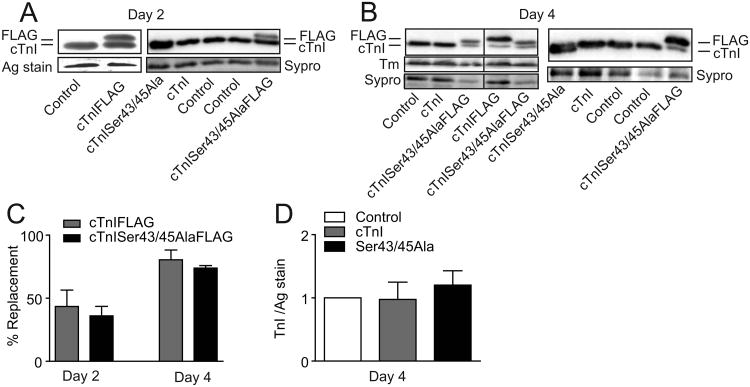
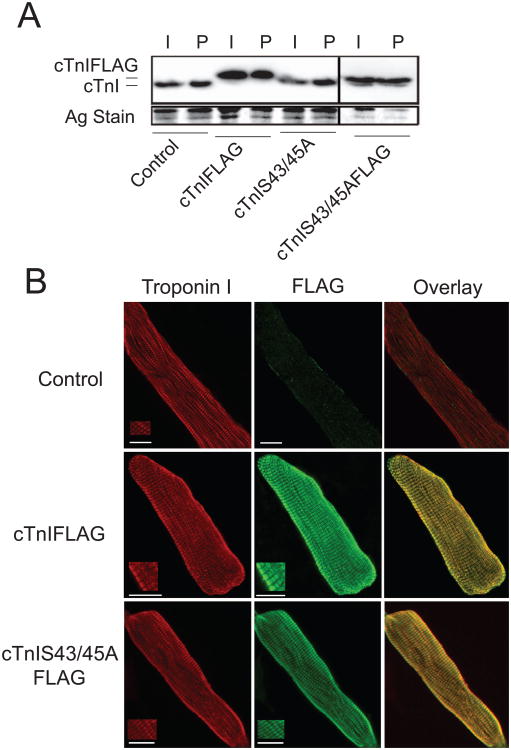
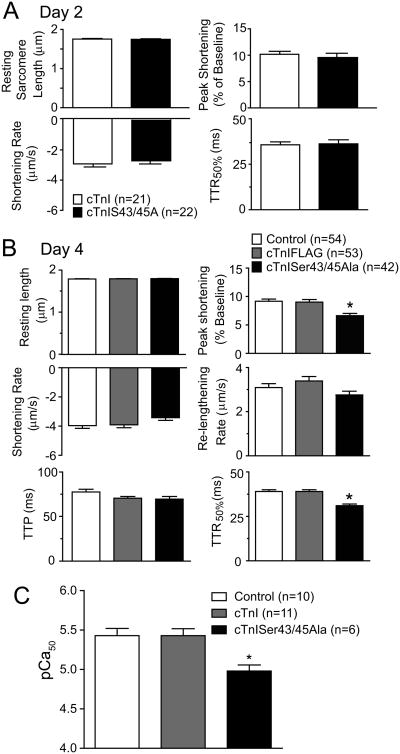
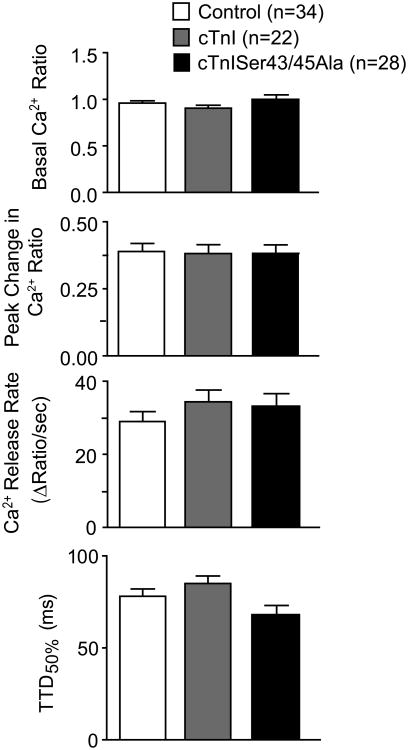
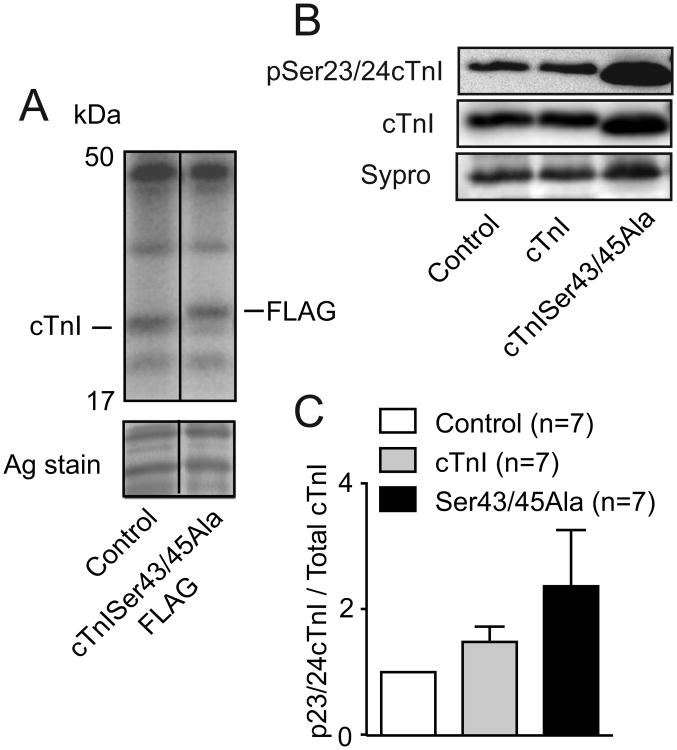
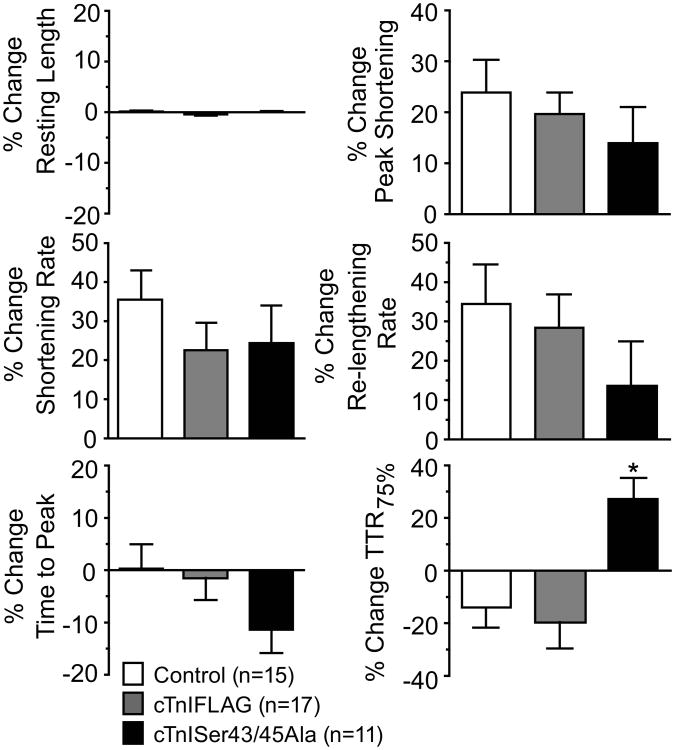
Phosphorylation of cardiac troponin I serines 43/45 (cTnISer43/45) by protein kinase C (PKC) is associated with cardiac dysfunction and yet there is disagreement about the role this cluster plays in modulating contractile performance. The present study evaluates the impact of phospho-null Ala substitutions at Ser43/45 (cTnISer43/45Ala) on contractile performance in intact myocytes. Viral-based gene transfer of cardiac troponin I (cTnI) or cTnISer43/45Ala resulted in time-dependent increases in expression, with 70-80% of endogenous cTnI replaced within 4days. Western analysis of intact and permeabilized myocytes along with immunohistochemistry showed each exogenous cTnI was incorporated into the sarcomere of myocytes. In contractile function studies, there were no differences in shortening and re-lengthening for cTnI and cTnISer43/45Ala-expressing myocytes 2days after gene transfer. However, more extensive replacement with cTnISer43/45Ala after 4days diminished peak shortening amplitude and accelerated re-lengthening measured as the time to 50% re-lengthening (TTR50%). A decrease in myofilament Ca(2+) sensitivity of tension also was observed in permeabilized myocytes expressing cTnISer43/45Ala and is consistent with accelerated re-lengthening observed in intact myocytes under basal conditions. Phosphorylation of cTnI Ser23/24 and the Ca(2+) transient were not changed in these myocytes. These results demonstrate extensive sarcomere expression of cTnISer43/45Ala directly modulates myofilament function under basal conditions. In further work, the accelerated re-lengthening observed in control or cTnI-expressing myocytes treated with the PKC agonist, endothelin-1 (ET, 10nM) was slowed in myocytes expressing cTnISer43/45Ala. This outcome may indicate Ser43/45 is targeted for phosphorylation by ET-activated PKC and/or influences transduction of this agonist-activated response.


Figures

Figure 1
Figure 1. Expression of cTnI and cTnISer43/45Ala with and without FLAG 2 and 4 days after gene transfer
A. Representative Western blot illustrating cTnI expression in myocytes 2 days after adenoviral-mediated gene transfer of cTnI, cTnIFLAG, cTnISer43/45Ala, and cTnISer43/45AlaFLAG into adult rat myocytes. B. Representative Western showing cTnI expression 4 days after gene transfer of the same recombinant viral constructs listed in A. A representative example of tropomyosin (Tm) also is shown in the left panel of B to demonstrate maintenance of thin filament stoichiometry. A silver-stained portion of gel is included in A (left panel) and a Sypro stained-band on the blot in A (right panel) and B to indicate protein loading. Samples shown in the left panel of B were separated on the same gel and the black line between samples indicates separation by additional samples. C. Quantitative comparison of endogenous cTnI replacement by cTnIFLAG and cTnISer43/45AlaFLAG 2 and 4 days after gene transfer. Results are expressed as FLAG expression as a percentage of total TnI expression. D. Quantitative analysis of cTnI stoichiometry in myocytes 4 days after gene transfer of cTnI or cTnISer43/45Ala. TnI expression is normalized to expression in control myocytes. A one-way ANOVA indicated there were no significant differences (p>0.05) in cTnI expression compared to controls in panel D.
Figure 2
Figure 2. Analysis of sarcomere incorporation of cTnI and cTnISer43/45Ala with and without FLAG tags
A. A representative Western comparing cTnIFLAG, cTnISer43/45Ala, and cTnISer43/45AlaFLAG expression in intact (I) and detergent permeabilized (P) myocytes 4 days after gene transfer. Samples shown were separated on the same gel and the black line between samples indicates separation by additional samples. A silver-stained portion of the gel is shown to indicate protein loading in each lane. There were no detectable differences in the expression detected in intact and permeabilized myocytes, which provides evidence of sarcomere incorporation for each construct. B. Projection confocal images showing cTnI (left panel; TR) and FLAG (middle panel; FITC) immunostaining along with the overlay (right panel) for control myocytes (top panels) and myocytes expressing cTnIFLAG (middle panels) and cTnISer43/45AlaFLAG (lower panel). Dual immunostaining for cTnI and FLAG were detected with TR and FITC, respectively as described in the Methods section. Insets for each myocyte are shown to demonstrate a higher resolution striated pattern of immunostaining. These results show sarcomere localization of cTnIFLAG and cTnISer43/45AlaFLAG in the myofilament.
Figure 3
Figure 3. Cardiac myocyte contractile function 2 and 4 days after gene transfer of cTnI constructs
A. Comparison of sarcomere shortening and re-lengthening measurements in control myocytes and myocytes expressing cTnISer43/45Ala 2 days after gene transfer. An unpaired Student's t-test indicated there were no significant differences between myocyte groups. In addition to these measurements, the time to peak (TTP), re-lengthening rate, and times to 25% and 75% re-lengthening also were not different between these 2 groups. B. Comparison of cardiac myocyte shortening and re-lengthening 4 days after gene transfer of cTnI and cTnISer43/45Ala. Results were compared using a one-way ANOVA and Newman-Keuls post-hoc test with p<0.05 (*) considered statistically significant from control values. Resting sarcomere length, shortening and re-lengthening rates and TTP were not different in control, and myocytes expressing cTnIFLAG, and cTnISer43/45Ala. The shortening amplitude decreased and there was an acceleration midway through re-lengthening (TTR50%) detected in myocytes expressing cTnISer43/456Ala. C. Quantification of pCa50 in control myocytes 4 days after gene transfer. Myofilament Ca2+ sensitivity was significantly reduced in Ser43/45Ala myocytes versus controls (Control 5.43±0.091, n=10, cTnI 5.43±0.088, n=11 and cTnISer43/45Ala-expressing myocytes 4.98±0.077, n=6). Statistical differences between the pCa50 values were identified using one-way ANOVA and Newman-Keuls post-hoc test with (*p<0.05) considered statistically significant.
Figure 4
Figure 4. Comparison of Ca2+-transients in Fura-2AM loaded myocytes 4 days after gene transfer
Basal and peak Ca2+ levels were similar in control, cTnI-, and cTnISer43/45Ala-expressing myocytes. The rates of Ca2+ release and decay also were similar among the 3 groups. There was a trend toward acceleration of Ca2+ decay, as indicated in the TTD50%, although a 1-way ANOVA indicated there was no statistically significant difference from control values (p>0.05).
Figure 5
Figure 5. Myofilament phosphorylation 4 days after gene transfer
A. Radiolabeling of proteins observed after 32P incorporation into control and cTnISer43/45Ala expressing myocytes. B. Representative Western blot showing Ser23/24 phosphorylation (top panel), cTnI expression (middle panel) and a band on the Sypro-stained blot (lower panel). C. Quantitative comparison of Ser23/24 phosphorylation in myocytes expressing cTnISer43/45Ala compared to controls and myocytes expressing cTnI. Total cTnI was normalized to a quantified band on Sypro-stained blots. A 1-way ANOVA and Newman-Keuls post-hoc tests showed there was no significant elevation in Ser23/24 phosphorylation in cTnISer43/45Ala- or cTnI-expressing myocytes.
Figure 6
Figure 6. Sarcomere shortening and re-lengthening in response to the PKC agonist, endothelin-1 (ET, 10 nM)
Experiments were performed using control myocytes and myocytes expressing cTnIFLAG or cTnISer43/45Ala 4 days after gene transfer. Results are expressed as a % change from basal during 15 minutes of ET. A 1-way ANOVA analysis and post-hoc Neuman-Keuls tests (*p<0.05) showed significant increases in TTR75% for cTnISer43/45Ala-expressing myocytes compared to controls. This increase indicates a slowing of relaxation in myocytes expressing cTnISer43/45Ala, and suggests Ser43/45 phosphorylation may preserve relaxation rate during the ET response. Measurement of times to 25% and 50% re-lengthening were not significantly different between the 3 groups.

Similar articles

Cited by

References

    1. Gordon AM, Regnier M, Homsher E. Skeletal and cardiac muscle contractile activation: tropomyosin “rocks and rolls”. News Physiol Sci. 2001;16:49–55. - PubMed
    1. Davis J, et al. Designing heart performance by gene transfer. Physiol Rev. 2008;88(4):1567–651. - PubMed
    1. Noland TA, Jr, Raynor RL, Kuo JF. Identification of sites phosphorylated in bovine cardiac troponin I and troponin T by protein kinase C and comparative substrate activity of synthetic peptides containing the phosphorylation sites. J Biol Chem. 1989;264(34):20778–85. - PubMed
    1. Noguchi T, et al. Thin-filament-based modulation of contractile performance in human heart failure. Circulation. 2004;110(8):982–7. - PubMed
    1. Zhang P, et al. Multiple Reaction Monitoring to Identify Site-Specific Troponin I Phosphorylated Residues in the Failing Human Heart. Circulation. 2012 - PMC - PubMed

Publication types

MeSH terms

LinkOut - more resources