. 2013 Jan;123(1):189-205.
doi: 10.1172/JCI64993. Epub 2012 Dec 17.

Hypoxia-inducible factor-dependent breast cancer-mesenchymal stem cell bidirectional signaling promotes metastasis

Affiliations

Hypoxia-inducible factor-dependent breast cancer-mesenchymal stem cell bidirectional signaling promotes metastasis

Pallavi Chaturvedi et al. J Clin Invest. 2013 Jan.

Erratum in

  • J Clin Invest. 2013 Mar 1;123(3):1402

Abstract

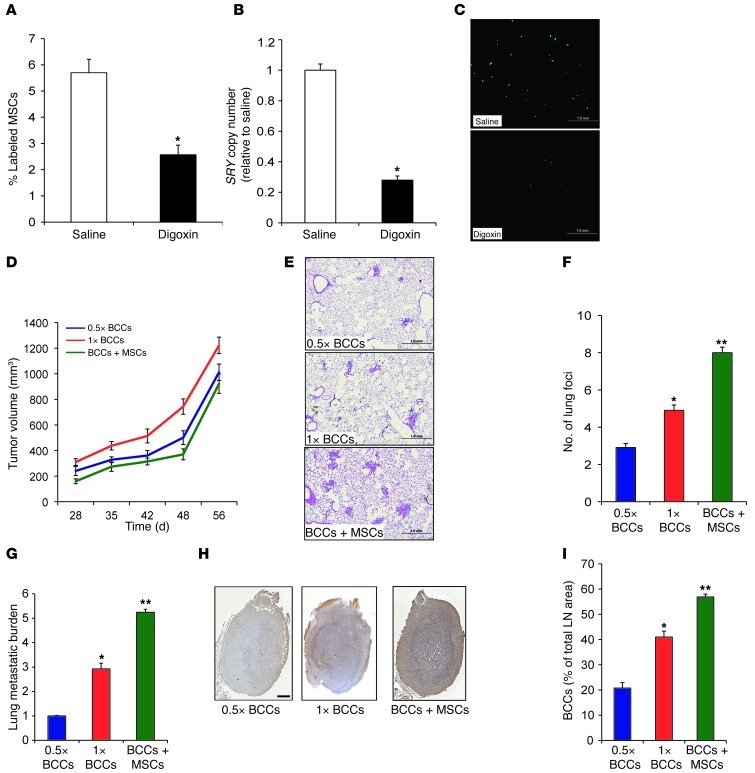
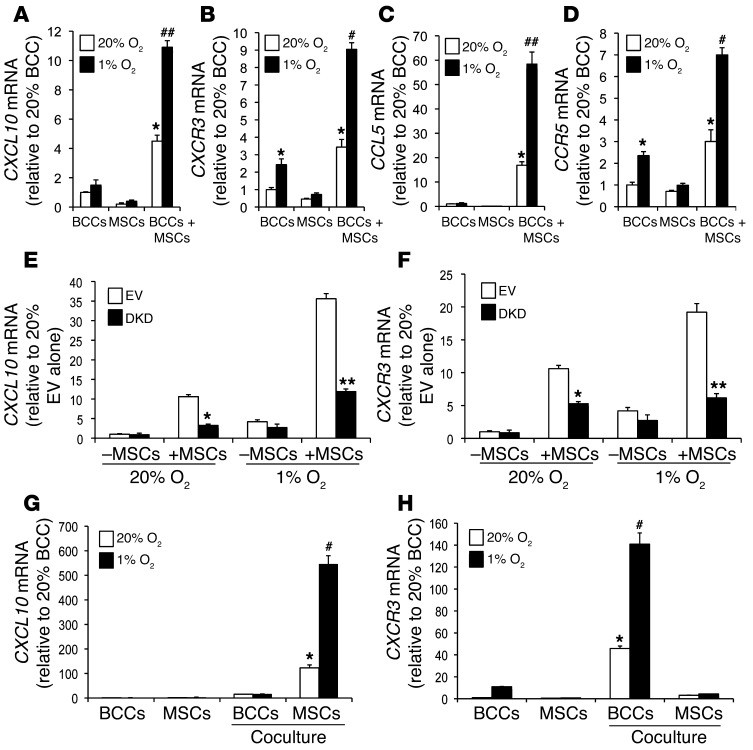
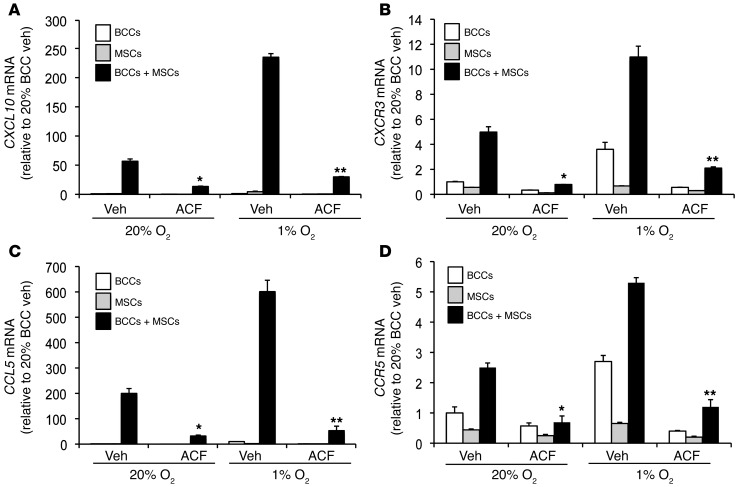
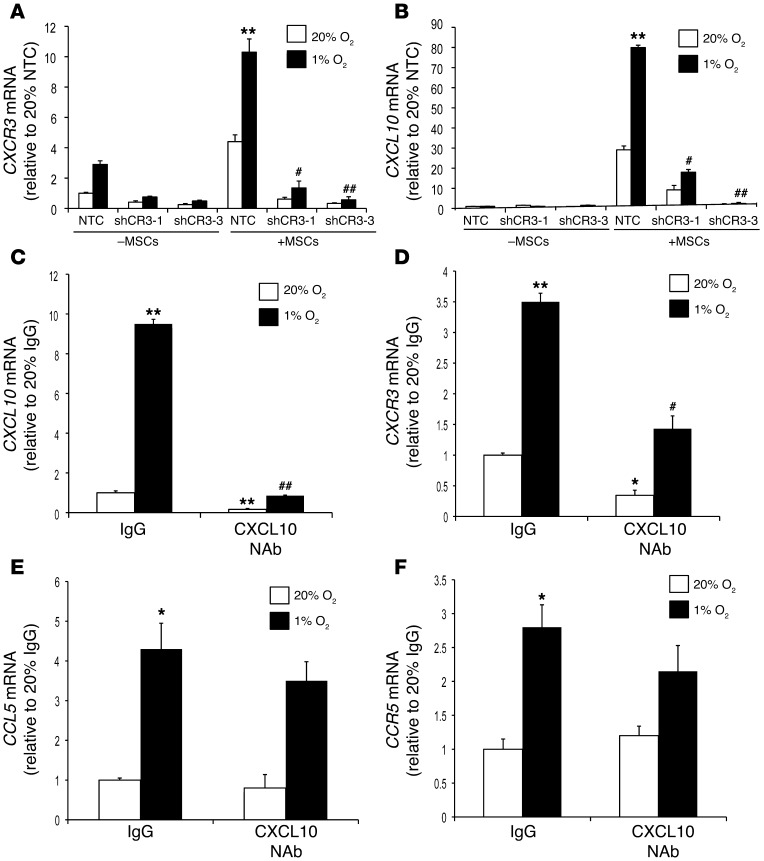
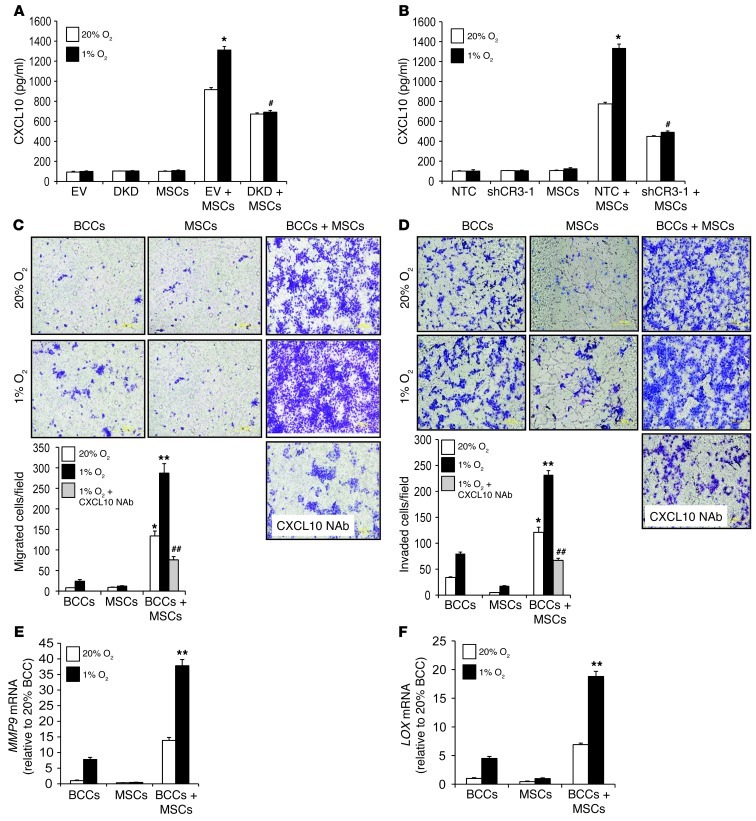
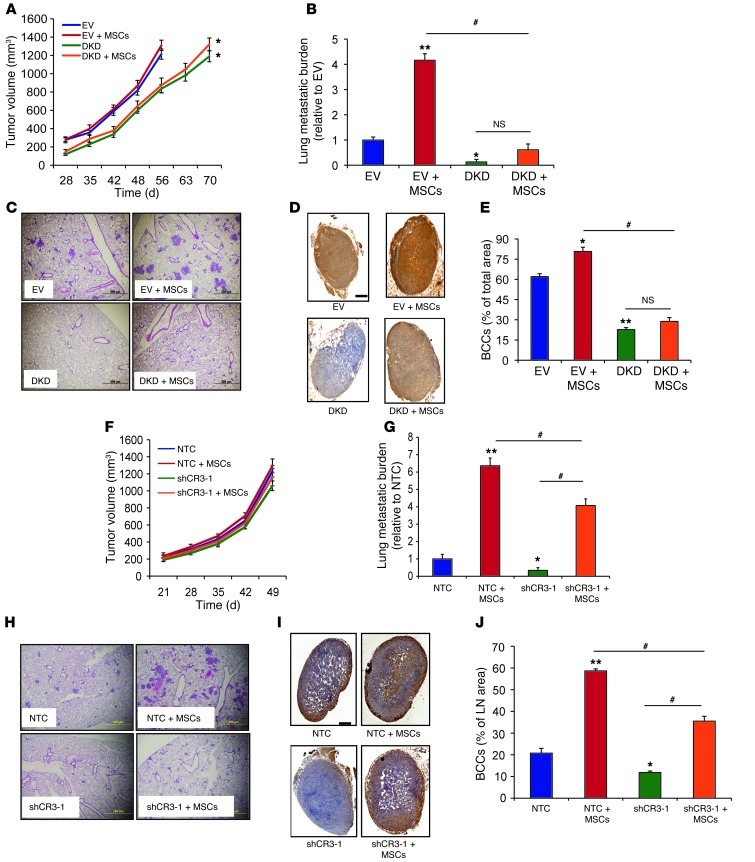
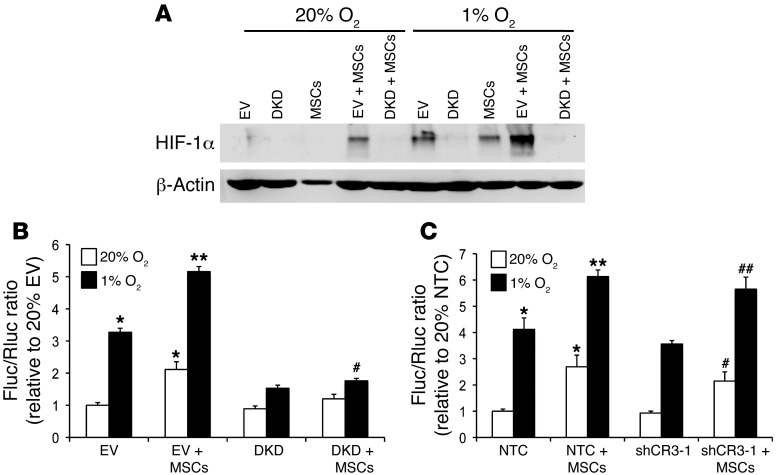
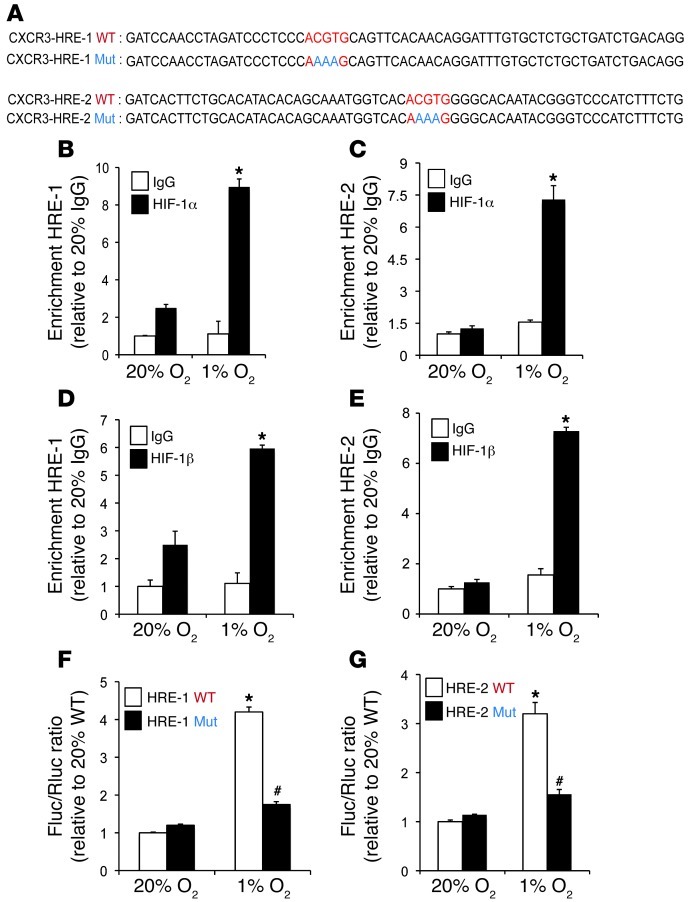
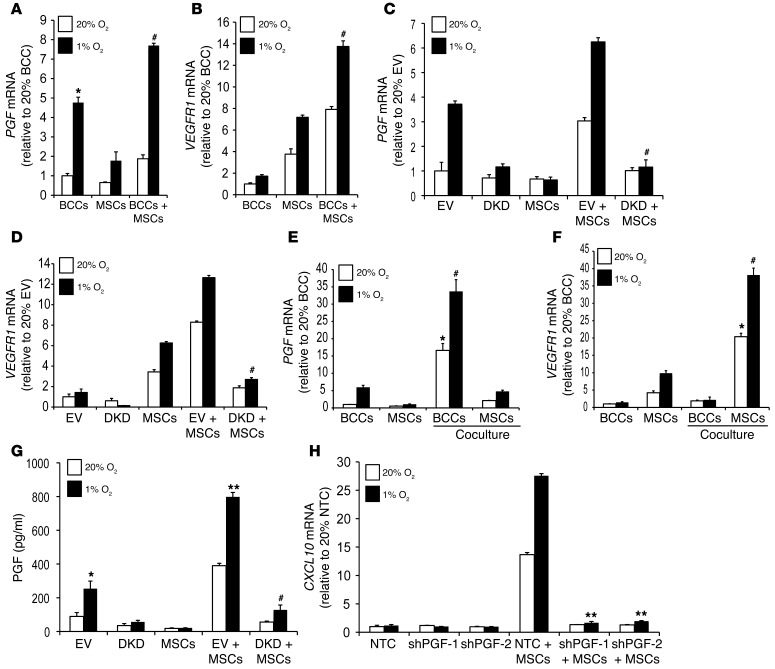
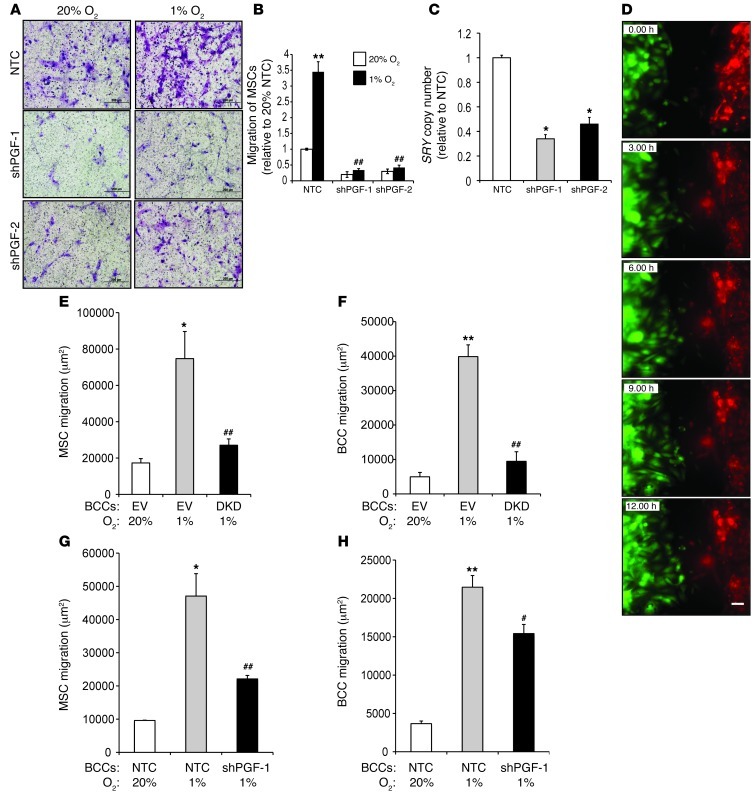
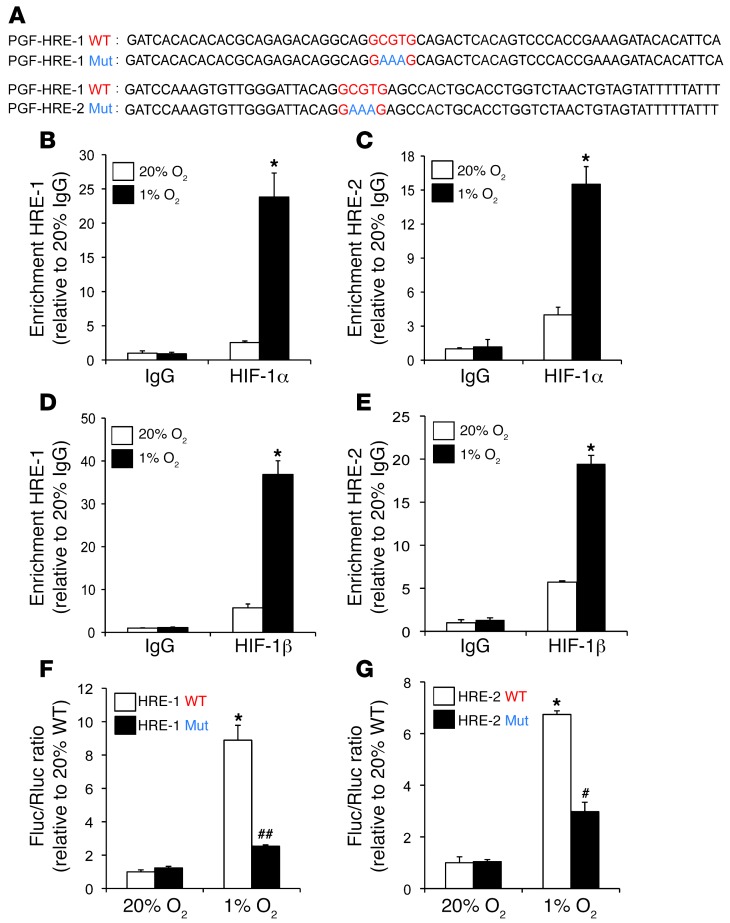
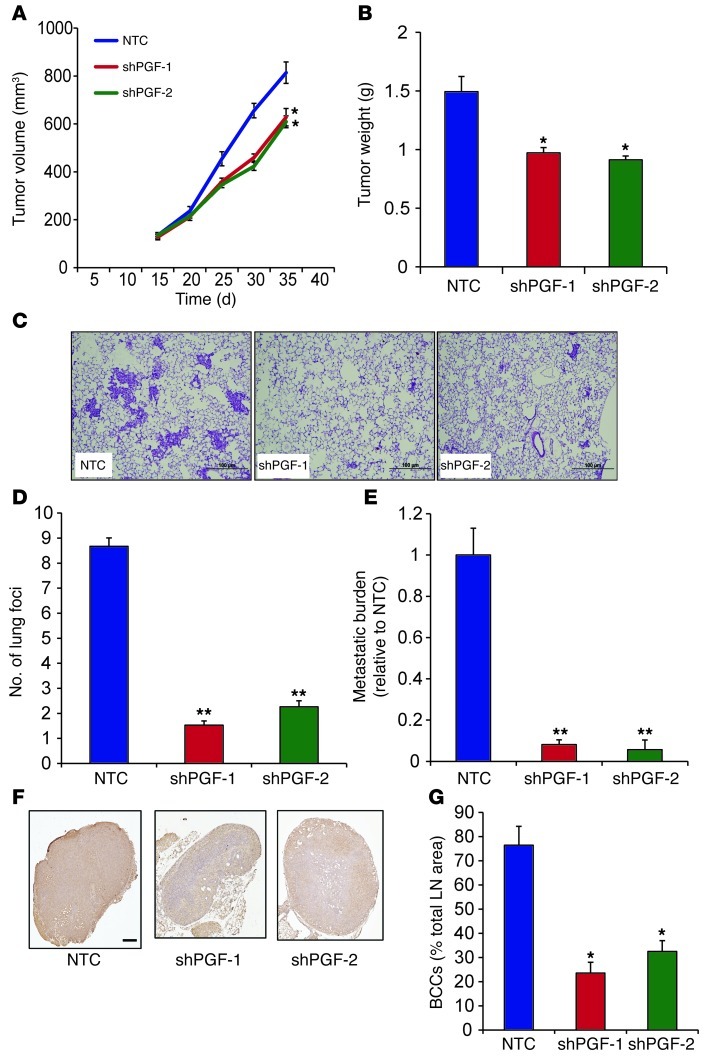
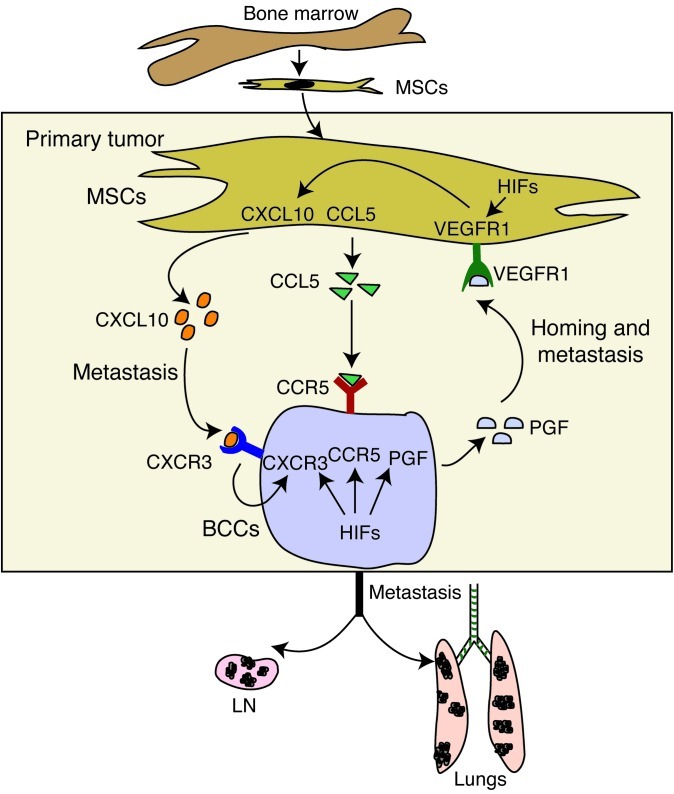
Metastasis involves critical interactions between cancer and stromal cells. Intratumoral hypoxia promotes metastasis through activation of hypoxia-inducible factors (HIFs). We demonstrate that HIFs mediate paracrine signaling between breast cancer cells (BCCs) and mesenchymal stem cells (MSCs) to promote metastasis. In a mouse orthotopic implantation model, MSCs were recruited to primary breast tumors and promoted BCC metastasis to LNs and lungs in a HIF-dependent manner. Coculture of MSCs with BCCs augmented HIF activity in BCCs. Additionally, coculture induced expression of the chemokine CXCL10 in MSCs and the cognate receptor CXCR3 in BCCs, which was augmented by hypoxia. CXCR3 expression was blocked in cocultures treated with neutralizing antibody against CXCL10. Conversely, CXCL10 expression was blocked in MSCs cocultured with BCCs that did not express CXCR3 or HIFs. MSC coculture did not enhance the metastasis of HIF-deficient BCCs. BCCs and MSCs expressed placental growth factor (PGF) and its cognate receptor VEGFR1, respectively, in a HIF-dependent manner, and CXCL10 expression by MSCs was dependent on PGF expression by BCCs. PGF promoted metastasis of BCCs and also facilitated homing of MSCs to tumors. Thus, HIFs mediate complex and bidirectional paracrine signaling between BCCs and MSCs that stimulates breast cancer metastasis.


Figures

Figure 1
Figure 1. MSCs are recruited to breast tumors and enhance lung and LN metastasis.
(AC) MDA-231 BCCs were implanted into the MFP of SCID mice, which were treated with saline or digoxin (2 mg/kg/d). After 1 week of treatment, CMFDA-labeled human MSCs were injected via tail vein, and tumors were harvested 16 hours later. (A and B) Percent CMFDA+ MSCs in the primary tumor was analyzed by FACS (A) and by qPCR for SRY copy number (B). Data are mean ± SEM (n = 5). *P < 0.05, Student’s t test. (C) Labeled MSCs in tumor sections were detected by fluorescence microscopy. Scale bar: 1 mm. (DI) SCID mice received MFP injection of 0.5 × 10⁶ (0.5×) or 1 × 10⁶ (1×) MDA-231 BCCs alone or 1 × 10⁶ cells from 1:1 coculture of BCCs+MSCs. Mice were euthanized 56 days later, and tumors, lungs, and ipsilateral axillary LNs were harvested. (D) Tumor volume plotted against time (mean ± SEM; n = 5). (E) H&E staining of lung sections. Scale bar: 1 mm. (F) Metastatic foci in lung sections (≥3 random fields per section) were counted under ×20 magnification. (G) Metastatic burden was determined by qPCR using human HK2 gene primers. (H) Immunohistochemical analysis of LN sections with human-specific vimentin antibody. Scale bar: 0.5 mm. (I) Percent total LN area occupied by BCCs (mean ± SEM; n = 5). *P < 0.05, **P < 0.01 vs. 0.5 × 10⁶ BCCs.
Figure 2
Figure 2. HIFs mediate coculture- and hypoxia-induced CXCL10, CXCR3, CCL5, and CCR5 expression.
(AD) BCCs, MSCs, or BCCs+MSCs were cultured at 20% or 1% O2 for 48 hours, and CXCL10 (A), CXCR3 (B), CCL5 (C), and CCR5 (D) mRNA levels were determined by RT-qPCR (mean ± SEM; n = 3). Levels were normalized to BCCs at 20% O2. *P < 0.05 vs. 20% BCCs or 20% MSCs; #P < 0.01, ##P < 0.001 vs. 20% BCCs+MSCs, 1-way ANOVA. (E and F) EV cells, DKD cells, EV+MSCs, or DKD+MSCs were cultured at 20% or 1% O2 for 48 hours. CXCL10 and CXCR3 mRNA levels were analyzed by RT-qPCR and normalized to those in EV cells at 20% O2 (mean ± SEM; n = 3). *P < 0.05 vs. 20% EV+MSCs; **P < 0.001 vs. 1% EV+MSCs, 1-way ANOVA. (G and H) GFP-expressing BCCs were cocultured with MSCs at 20% or 1% O2 for 48 hours, then subjected to FACS based on GFP fluorescence for BCCs and CD105 immunofluorescence for MSCs. CXCR3 and CXCL10 mRNA levels were determined in flow-sorted BCCs and MSCs. BCCs and MSCs cultured alone were used as controls. Levels were normalized to BCCs at 20% O2. *P < 0.01 vs. 20% MSCs or BCCs alone; #P < 0.001 vs. 1% MSCs or BCCs alone, 1-way ANOVA.
Figure 3
Figure 3. Acriflavine blocks coculture-induced expression of CCL5, CCR5, CXCL10, and CXCR3.
BCCs, MSCs, or BCCs+MSCs were treated with 1 μM acriflavine (ACF) or 0.02% DMSO vehicle (Veh) and exposed to 20% or 1% O2 for 48 hours prior to RNA isolation. CXCL10 (A), CXCR3 (B), CCL5 (C), and CCR5 (D) mRNA levels were analyzed by RT-qPCR (mean ± SEM; n = 3). Levels were normalized to vehicle-treated BCCs at 20% O2. *P < 0.01 vs. 20% BCCs+MSCs vehicle; **P < 0.001 vs. 1% BCCs+MSCs vehicle, 1-way ANOVA.
Figure 4
Figure 4. Hypoxia augments crosstalk between BCCs and MSCs by promoting CXCL10-CXCR3 signaling.
(A and B) NTC, shCR3-1, and shCR3-3 MDA-231 subclones were cultured alone or cocultured with MSCs and exposed to 20% or 1% O2 for 48 hours. Expression of CXCR3 (A) and CXCL10 (B) mRNA was analyzed by RT-qPCR. Levels were normalized to NTC cells at 20% O2. **P < 0.001 vs. 20% NTC+MSCs; #P < 0.01, ##P < 0.001 vs. 1% NTC+MSCs. (CF) BCCs+MSCs were treated with CXCL10 Nab or IgG control and exposed to 20% or 1% O2 for 48 hours. Expression of CXCL10 (C), CXCR3 (D), CCL5 (E), and CCR5 (F) mRNA was analyzed by RT-qPCR; levels were normalized to IgG at 20% O2 (mean ± SEM; n = 3). *P < 0.01, **P < 0.001 vs. 20% IgG; #P < 0.05, ##P < 0.001 vs. 1% IgG, 1-way ANOVA.
Figure 5
Figure 5. CXCL10 enhances BCC migration and invasion.
(A) CM was isolated from cultures of EV cells, DKD cells, MSCs, EV+MSCs, and DKD+MSCs, and ELISA was performed to determine CXCL10 levels (mean ± SEM; n = 3). *P < 0.05 vs. 20% EV+MSCs; #P < 0.01 vs. 1% EV+MSCs, ANOVA. (B) ELISA was performed to determine CXCL10 protein levels (mean ± SEM; n = 3) from NTC cells, shCR3-1 cells, MSCs, NTC+MSCs, and shCR3-1+MSCs. *P < 0.01 vs. 20% NTC+MSCs; #P < 0.01 vs. 1% NTC+MSCs. (C) Naive MDA-231 BCCs were seeded on the top of a Boyden chamber. The number of cells that migrated through the uncoated filter in response to CM from BCCs, MSCs, or BCCs+MSCs (alone or in the presence of CXCL10 NAb) in the lower chamber was counted. The mean number of cells per field was determined from 5 fields per filter (mean ± SEM; n = 3 experiments). *P < 0.05, **P < 0.001 vs. 1% BCCs; ##P < 0.001 vs. 1% BCCs+MSCs. Scale bar: 500 μm. (D) Naive MDA-231 BCCs were seeded on top of Matrigel-coated chamber inserts. The number of cells that invaded through the Matrigel in response to CM from BCCs, MSCs, or BCCs+MSCs (with or without CXCL10 NAb) was counted (mean ± SEM; n = 3). *P < 0.05, **P < 0.001 vs. 1% BCCs; ##P < 0.001 vs. 1% BCCs+MSCs, ANOVA. Scale bar: 500 μm. (E and F) BCCs, MSCs, and BCCs+MSCs were analyzed for MMP9 (E) and LOX (F) mRNA levels, which were normalized to BCCs at 20% O2. **P < 0.001 vs. all other conditions.
Figure 6
Figure 6. Effect of MSC coculture on metastasis is lost when HIF or CXCR3 expression is inhibited in BCCs.
(AE) EV cells (1 × 10⁶), DKD cells (1 × 10⁶), and EV+MSCs and DKD+MSCs (0.5 × 10⁶ each) were cultured for 48 hours and implanted in the MFP. (A) Primary tumor volumes were measured. Lungs and LNs were harvested when the volume reached 1,300 mm3. (B) Lung DNA was isolated and used to quantify metastatic burden by qPCR with human-specific HK2 primers. (C) H&E-stained lung sections. Scale bar: 200 μm. (D) LN sections were analyzed with human-specific vimentin antibody. Scale bar: 0.5 mm. (E) Percent total LN area occupied by BCCs, determined by image analysis (mean ± SEM; n = 5). *P < 0.05, **P < 0.001 vs. EV; #P < 0.05 as indicated, ANOVA. (FJ) NTC cells (1 × 10⁶), shCR3-1 cells (1 × 10⁶), and NTC+MSCs and shCR3-1+MSCs (0.5 × 10⁶ each) were implanted in MFP. (F) Tumor volume. Lungs and LNs were harvested on day 50. (G) Lung DNA was isolated and used to quantify metastatic burden. (H) H&E-stained lung sections. Scale bar: 100 μm. (I) LN sections were analyzed with human-specific vimentin antibody. Scale bar: 0.5 mm. (J) Percent total LN area occupied by BCCs (mean ± SEM; n = 5). *P < 0.05, **P < 0.001 vs. NTC; #P < 0.05 as indicated, ANOVA.
Figure 7
Figure 7. Coculture of BCCs+MSCs enhances HIF-1α expression and HIF transcriptional activity in BCCs.
(A) HIF-1α protein levels in EV cells, DKD cells, MSCs, EV+MSCs, and DKD+MSCs cultured at 20% or 1% O2. β-Actin was used as a loading control. (B) EV and DKD cells were cotransfected with p2.1 and pSV-Renilla and cocultured with MSCs or not for 48 hours at 20% or 1% O2. The Fluc/Rluc ratio was normalized to the value for EV cells at 20% O2. *P < 0.05, **P < 0.001 vs. 20% EV; #P < 0.05 vs. 1% EV, 1-way ANOVA. (C) NTC and shCR3-1 cells were cotransfected with p2.1 and pSV-Renilla and cocultured with MSCs or not for 48 hours at 20% or 1% O2. The Fluc/Rluc ratio was normalized to NTC cells at 20% O2 (mean ± SEM; n = 3). *P < 0.05, **P < 0.001 vs. 20% NTC; #P < 0.05 vs. 20% shCR3-1; ##P < 0.01 vs. 1% shCR3-1, 1-way ANOVA.
Figure 8
Figure 8. CXCR3 is a HIF-1 target gene.
(A) Candidate HREs were identified in the 5′-flanking region (HRE-1) and 3′-untranslated region (HRE-2) of the human CXCR3 gene. HREs containing the WT (5′-ACGTG-3′) or mutant (Mut; 5′-AAAAG-3′) HIF-1 binding site sequence were inserted into the Fluc vector pGL2 promoter. (BE) MDA-231 BCCs were incubated at 20% or 1% O2 for 24 hours, and ChIP assays were performed using IgG, HIF-1α, or HIF-1β antibodies. Specific primers flanking HRE-1 and HRE-2 were used for qPCR, and values were normalized to IgG at 20% O2 (mean ± SEM; n = 3). *P < 0.05 vs. all other conditions, Student’s t test on log-converted values. (F and G) pGL2 promoter containing WT or mutant HRE was cotransfected with pSV-Renilla into MDA-231 BCCs, which were incubated at 20% or 1% O2 for 24 hours. The Fluc/Rluc ratio was normalized to WT at 20% O2 (mean ± SEM; n = 3). *P < 0.05 vs. 20% WT; #P < 0.05 vs. 1% WT, Student’s t test.
Figure 9
Figure 9. HIF regulates PGF and VEGFR1 expression and facilitates bidirectional signaling.
(A and B) BCCs, MSCs, or BCCs+MSCs were cultured at 20% or 1% O2 for 48 hours. PGF and VEGFR1 mRNA levels, determined by RT-qPCR, were normalized to those in BCCs at 20% O2. *P < 0.05 vs. 20% BCCs; #P < 0.01 vs. 20% BCCs+MSCs, ANOVA. (C and D) EV cells, DKD cells, MSCs, EV+MSCs, and DKD+MSCs were exposed to 20% or 1% O2 for 48 hours. PGF and VEGFR1 mRNA levels were normalized to those in BCCs at 20% O2. #P < 0.01 vs. 1% EV+MSCs. (E and F) GFP+ BCCs were cocultured with MSCs at 20% or 1% O2 for 48 hours, followed by FACS based on GFP fluorescence of BCCs and CD105 immunofluorescence of MSCs. RNA was extracted from flow-sorted cells for analysis of PGF and VEGFR1 expression. *P < 0.05 vs. 20% MSCs or BCCs alone; #P < 0.01 vs. 1% MSCs or BCCs alone. (G) CM was isolated from EV cells, DKD cells, MSCs, EV+MSCs, and DKD+MSCs cultured for 48 hours at 20% or 1% O2. ELISA was performed to determine PGF protein levels in CM (mean ± SEM; n = 3). *P < 0.05, **P < 0.001 vs. 20% EV; #P < 0.01 vs. 1% EV+MSCs, ANOVA. (H) NTC, shPGF-1, and shPGF-2 MDA-231 subclones were cultured alone or with MSCs at 20% or 1% O2 for 48 hours. CXCL10 mRNA expression was analyzed by RT-qPCR (mean ± SEM; n = 3). **P < 0.001 vs. 1% NTC+MSCs, ANOVA.
Figure 10
Figure 10. HIF and PGF expressed by BCCs are required for MSC migration and homing.
(A and B) Migration of MSCs in response to CM isolated from NTC, shPGF-1, and shPGF-2 MDA-231 subclones cultured at 20% or 1% O2. MSCs were seeded on the top of the Boyden chamber, and the number of cells that migrated through the filter in response to CM in the lower chamber was counted under light microscopy after staining with crystal violet. Data were normalized to CM isolated from NTC cells at 20% O2. **P < 0.001 vs. 20% NTC; ##P < 0.005 vs. 1% NTC. Scale bar: 200 μm. (C) 1 × 10⁶ NTC, shPGF-1, or shPGF-2 cells were implanted into the MFP of SCID mice. Recruitment of MSCs to the primary tumor was analyzed by qPCR for SRY (mean ± SEM; n = 5). *P < 0.05 vs. NTC, Student’s t test. (D) Representative images acquired by time-lapse photomicroscopy of labeled MDA-231 BCCs (green) and MSCs (red) cocultured in a LiveAssay 2-chamber device coated with fibronectin. Scale bar: 200 μm. (E and F) Migration of MSCs (E) and EV or DKD BCCs (F) after 12 hours of coculture. *P < 0.05, **P < 0.01 vs. 20% EV; ##P < 0.01 vs. 1% EV. (G and H) Migration of MSCs (G) and NTC or shPGF-1 BCCs (H) after 12 hours of coculture. *P < 0.05, **P < 0.01 vs. 20% NTC; #P < 0.05, ##P < 0.01 vs. 1% NTC.
Figure 11
Figure 11. PGF is a HIF-1 target gene.
(A) Candidate HREs were identified in the 5′-flanking region. HRE-1 and HRE-2 were located 0.2 kb and 2 kb, respectively, from the transcription start site. HREs containing WT (5′-GCGTG-3′) or mutant (5′-GAAAG-3′) HIF-1 binding site sequences were inserted into pGL2 promoter. (BE) MDA-231 BCCs were incubated at 20% or 1% O2 for 24 hours, and ChIP assays were performed using IgG, HIF-1α, or HIF-1β antibodies. Specific primers flanking HRE-1 and HRE-2 were used for qPCR, and values were normalized to IgG at 20% O2 (mean ± SEM; n = 3). *P < 0.05 vs. all other conditions, Student’s t test on log-converted values. (F and G) WT and mutant HRE sequences were inserted into pGL2 promoter and cotransfected with pSV-Renilla into MDA-231 BCCs, which were incubated at 20% or 1% O2 for 24 hours. The Fluc/Rluc ratio was normalized to WT at 20% O2 (mean ± SEM; n = 3). *P < 0.05 vs. 20% WT; #P < 0.05, ##P < 0.005 vs. 1% WT, Student’s t test.
Figure 12
Figure 12. PGF promotes lung and LN metastasis of BCCs.
1 × 10⁶ NTC, shPGF-1, and shPGF-2 MDA-231 subclones were implanted in the MFP of SCID mice. (A) Primary tumor volumes were determined serially. *P < 0.05 vs. NTC, 1-way ANOVA. (B) Primary tumor weights were measured at the end of the experiment. *P < 0.05 vs. NTC, 1-way ANOVA. (C) Photomicrographs of H&E-stained lung sections. Scale bar: 100 μm. (D) Metastatic foci in lung sections. At least 3 random fields were counted per section. **P < 0.005 vs. NTC, 1-way ANOVA. (E) Lung DNA was analyzed by qPCR with human HK2 primers to quantify metastatic burden. **P < 0.005 vs. NTC, 1-way ANOVA. (F) LN sections were stained with human-specific vimentin antibody. Scale bar: 0.5 mm. (G) LN metastasis was quantified by image analysis. *P < 0.05 vs. NTC, 1-way ANOVA.
Figure 13
Figure 13. Bidirectional signaling between BCCs and MSCs.
Hypoxia induces recruitment of bone marrow–derived MSCs to the primary tumor site. MSC-BCC interaction induces CXCL10, CCL5, and VEGFR1 expression in MSCs and CXCR3, CCR5, and PGF expression in BCCs. MSC→BCC interaction is mediated by CCL5→CCR5 and CXCL10→CXCR3 signaling. BCC→MSC interaction is mediated by PGF→VEGFR1 signaling, which induces CXCL10 expression in MSCs and thereby establishes a positive feedback loop between the 2 cell types. The PGF→VEGFR1 interaction is important for MSC homing, and CXCL10→CXCR3 and CCL5→CCR5 signaling promote BCC metastasis. The consequence of these interactions is the expression of genes that enhance invasion and the metastasis of BCCs to the lungs and LNs. The expression of CXCR3 and PGF (and probably CCR5) in BCCs as well as VEGFR1 (and perhaps CXCL10 and CCL5) in MSCs are regulated by HIFs.

References

    1. Joyce JA, Pollard JW. Microenvironmental regulation of metastasis. Nat Rev Cancer. 2009;9(4):239–252. doi: 10.1038/nrc2618. - DOI - PMC - PubMed
    1. Wyckoff J, et al. A paracrine loop between tumor cells and macrophages is required for tumor cell migration in mammary tumors. Cancer Res. 2004;64(19):7022–7029. doi: 10.1158/0008-5472.CAN-04-1449. - DOI - PubMed
    1. Goswami S, et al. Macrophages promote the invasion of breast carcinoma cells via a colony-stimulating factor-1/epidermal growth factor paracrine loop. Cancer Res. 2005;65(12):5278–5283. doi: 10.1158/0008-5472.CAN-04-1853. - DOI - PubMed
    1. Carmeliet P, Jain RK. Angiogenesis in cancer and other diseases. Nature. 2000;407(6801):249–257. doi: 10.1038/35025220. - DOI - PubMed
    1. Cardenas-Navia LI, Mace D, Richardson RA, Wilson DF, Shan S, Dewhirst MW. The pervasive presence of fluctuating oxygenation in tumors. Cancer Res. 2008;68(14):5812–5819. doi: 10.1158/0008-5472.CAN-07-6387. - DOI - PubMed

Publication types

MeSH terms