. 2013 Mar;33(6):1233-43.
doi: 10.1128/MCB.01604-12. Epub 2013 Jan 14.

The QKI-5 and QKI-6 RNA binding proteins regulate the expression of microRNA 7 in glial cells

Affiliations

The QKI-5 and QKI-6 RNA binding proteins regulate the expression of microRNA 7 in glial cells

Yunling Wang et al. Mol Cell Biol. 2013 Mar.

Abstract

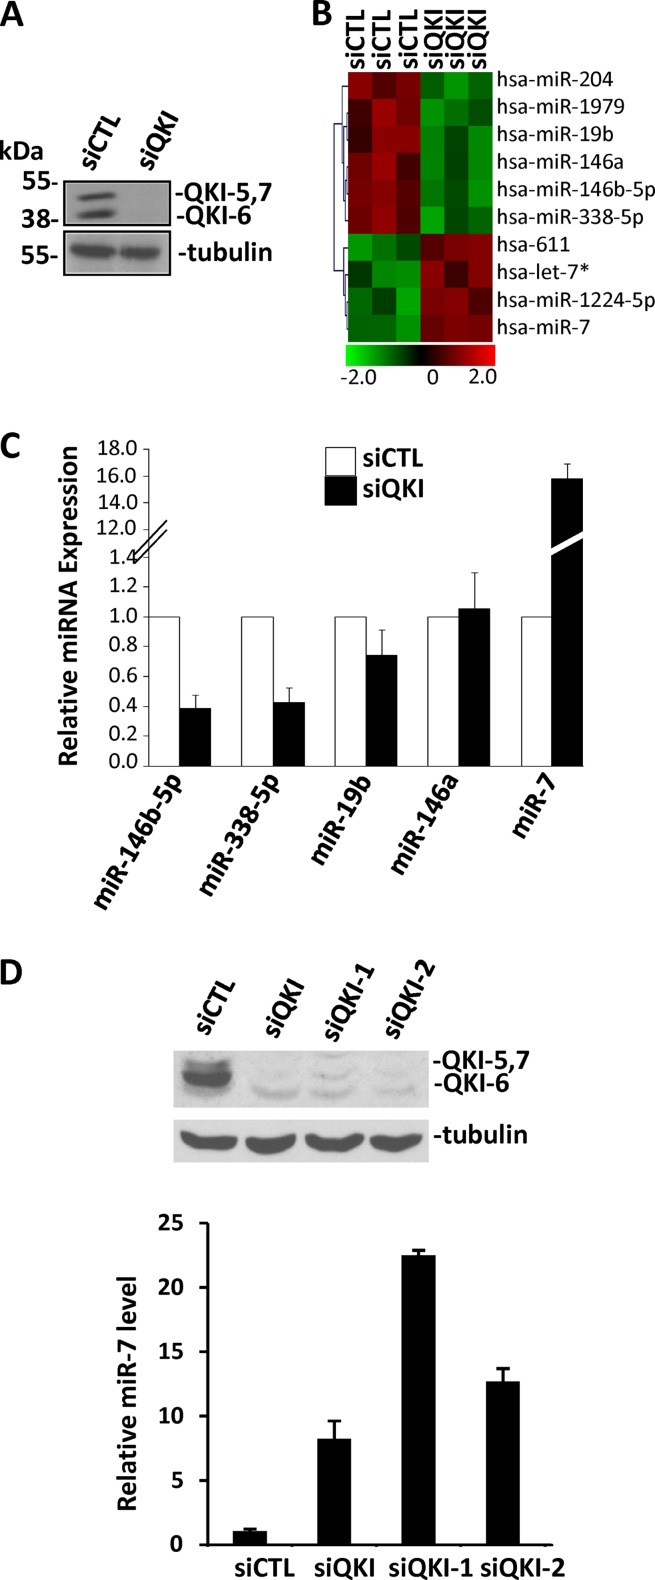
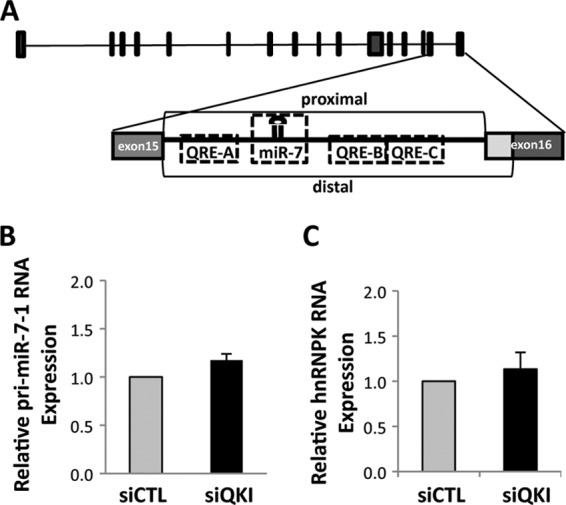
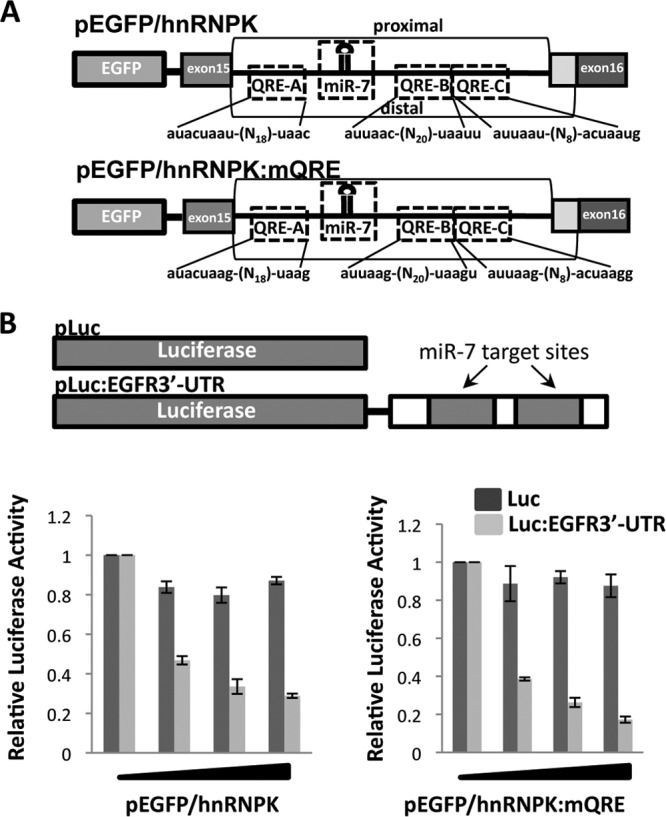
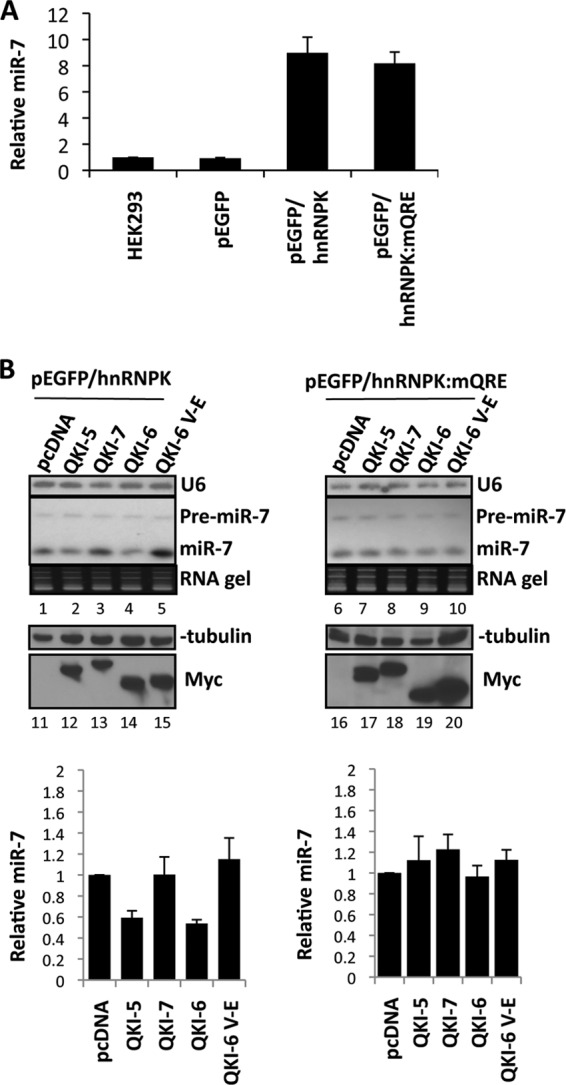
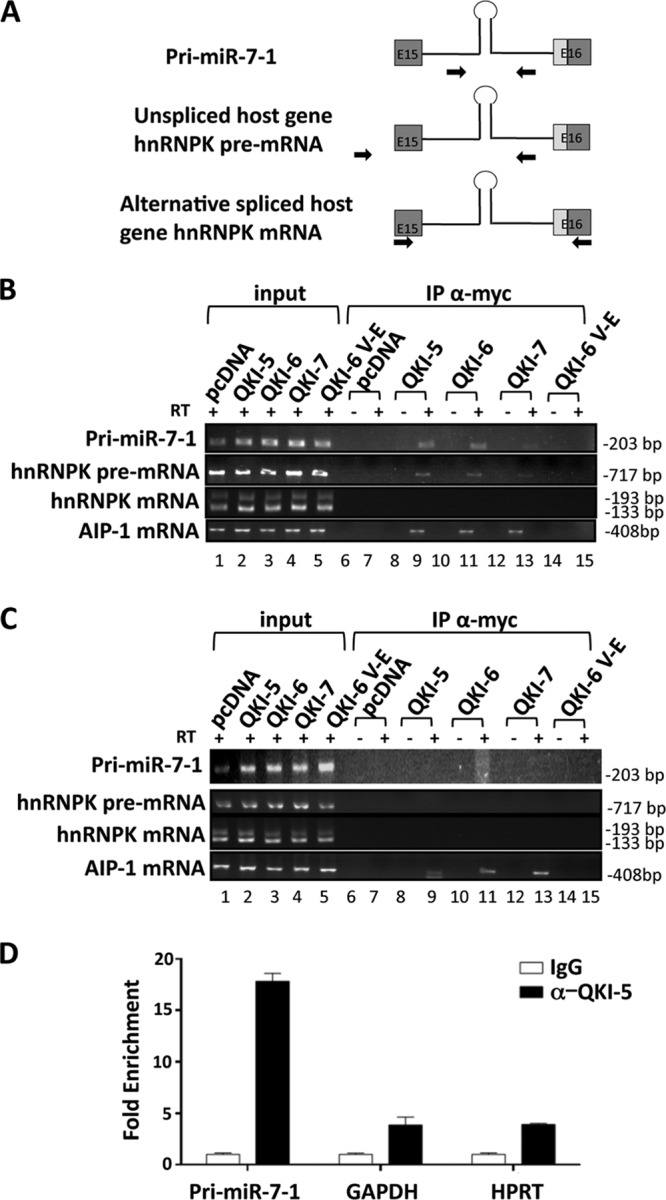
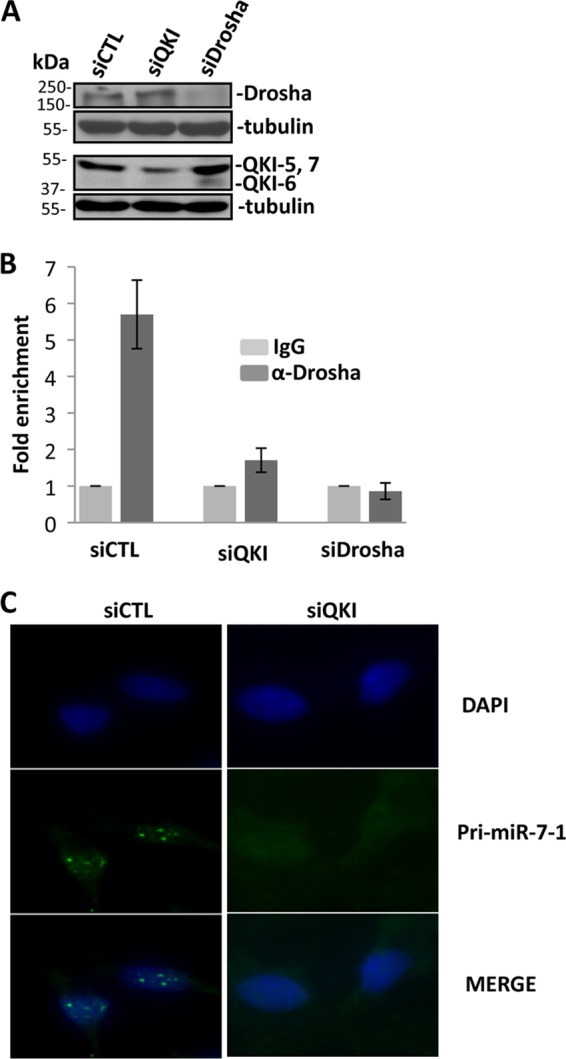
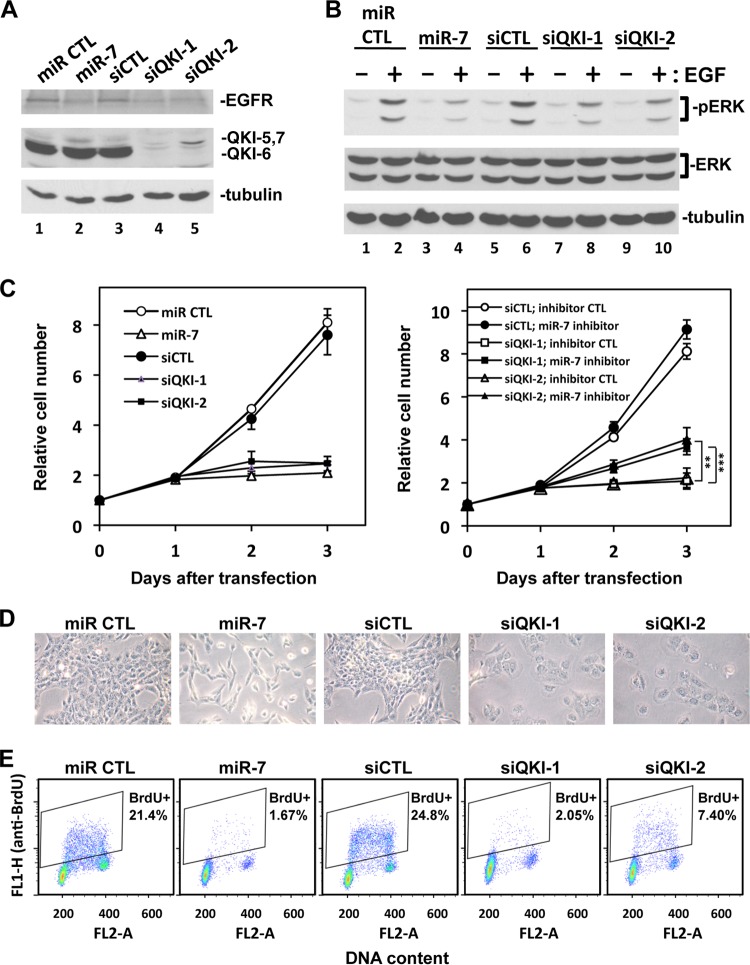
The quaking (qkI) gene encodes 3 major alternatively spliced isoforms that contain unique sequences at their C termini dictating their cellular localization. QKI-5 is predominantly nuclear, whereas QKI-6 is distributed throughout the cell and QKI-7 is cytoplasmic. The QKI isoforms are sequence-specific RNA binding proteins expressed mainly in glial cells modulating RNA splicing, export, and stability. Herein, we identify a new role for the QKI proteins in the regulation of microRNA (miRNA) processing. We observed that small interfering RNA (siRNA)-mediated QKI depletion of U343 glioblastoma cells leads to a robust increase in miR-7 expression. The processing from primary to mature miR-7 was inhibited in the presence QKI-5 and QKI-6 but not QKI-7, suggesting that the nuclear localization plays an important role in the regulation of miR-7 expression. The primary miR-7-1 was bound by the QKI isoforms in a QKI response element (QRE)-specific manner. We observed that the pri-miR-7-1 RNA was tightly bound to Drosha in the presence of the QKI isoforms, and this association was not observed in siRNA-mediated QKI or Drosha-depleted U343 glioblastoma cells. Moreover, the presence of the QKI isoforms led to an increase presence of pri-miR-7 in nuclear foci, suggesting that pri-miR-7-1 is retained in the nucleus by the QKI isoforms. miR-7 is known to target the epidermal growth factor (EGF) receptor (EGFR) 3' untranslated region (3'-UTR), and indeed, QKI-deficient U343 cells had reduced EGFR expression and decreased ERK activation in response to EGF. Elevated levels of miR-7 are associated with cell cycle arrest, and it was observed that QKI-deficient U343 that harbor elevated levels of miR-7 exhibited defects in cell proliferation that were partially rescued by the addition of a miR-7 inhibitor. These findings suggest that the QKI isoforms regulate glial cell function and proliferation by regulating the processing of certain miRNAs.


Figures

Fig 1
Fig 1
Identification of QKI regulated miRNAs in U343 glioblastoma cells. (A) Cell extracts prepared from U343 cells transfected with siCTL or siQKI were separated by SDS-PAGE and immunoblotted with anti-pan-QKI antibodies and β-tubulin as a loading control. (B) Total RNA purified from siCTL- and siQKI-transduced U343 cells was analyzed for miRNA expression using miRNA microarray analysis by LC Sciences. The heat map indicates the differential expression of miRNAs in the siCTL- versus siQKI-transduced cells. Each row represents a different mature miRNA sequence. Shown are median values from normalized, log ratio (base 2) data sets and plotted as a heat map from three biological and technical replicates. Green indicates decreasing miRNA expression, whereas red indicates increasing miRNA expression. (C) TaqMan qRT-PCR was performed to verify the changes observed in the microarray. miRNAs with signals of >500 and a log2 change (siQKI/siLuc) of <−1 or >1 were verified. The data shown represent the mean expression level of 3 different biological replicates calculated by ΔCT normalized to the endogenous GAPDH control of 3 independent experiments performed in triplicate. Error bars represent standard deviations of the means. (D) U343 cells were transfected with the indicated control or QKI siRNAs and the levels of miR-7 monitored by TaqMan qRT-PCR.
Fig 2
Fig 2
QKI does not affect the transcriptional regulation of pri-miR-7-1. (A) Schematic illustration of human hnRNPK gene with the pri-miR-7-1 located within intron 15 with its multiple QREs. The proximal and distal 3′ splice sites of the hnRNPK gene are shown. (B and C) RNA isolated from siCTL and siQKI U343 cells was analyzed by qRT-PCR for intronic pri-miR-7-1 and hnRNPK mRNA expression. The data for siCTL were normalized to 1.0; the data are shown as means and standard errors of the means.
Fig 3
Fig 3
Generation of miR-7 expression vectors with or without QREs. (A) Schematic illustration of the hnRNPK minigene (pEGFP/hnRNPK). The putative QREs with their sequences are shown, as well as the location of miR-7. The mutated hnRNPK reporter gene is shown (pEGFP/hnRNPK:mQRE). (B) The pMIR-REPORT Luciferase (pLuc) and pMIR-REPORT Luciferase harboring sequences from the 3′-UTR of the EGF receptor with the miR-7 targeting sequences (pLuc:EGFR3′-UTR) are depicted. HEK293 cells were cotransfected with pLuc or pLuc:EGFR3′-UTR, along with increasing amounts of either the wild-type hnRNPK minigene (pEGFP/hnRNPK) or the mutated minigene (pEGFP/hnRNPK:mQRE), and assayed for luciferase activity normalized to that for Renilla.
Fig 4
Fig 4
QKI-5 and QKI-6 abrogate mature miR-7 processing. (A) The levels of miR-7 were measure by real-time qRT-PCR in HEK293 or HEK293 cells stably expressing the indicated plasmids. (B) HEK293 cells stably expressing the indicated hnRNPK minigene were transfected with pcDNA empty vector or expression vectors encoding myc epitope-tagged QKI-5, QKI-6, QKI-7, or QKI-6:V-E (20 μg of plasmid in a 10-cm culture dish). After 48 h, the RNA was extracted and 10 μg of total RNA was loaded and resolved on 12% polyacrylamide TED-urea gels and transferred onto Hybond-N+ membranes. The membranes were hybridized with a U6 antisense and mature miR-7 antisense LNA (Exiqon) probe labeled at the 5′ end with 32P. The ethidium bromide-stained RNA gel is shown (lanes 1 to 10). The experiment was performed in triplicate, and results were quantified as the means and standard errors of the means. Protein extracts were also prepared and immunoblotted with anti-β-tubulin as a loading control and anti-Myc antibodies to visualize the QKI expression (lanes 11 to 20). The quantification is depicted at the bottom.
Fig 5
Fig 5
Association of the pri-miR-7 RNA with the QKI isoforms. (A) Schematic illustration of PCR primers used to detect the pri-miR-7-1 mRNA, the hnRNPK pre-mRNA, and mature mRNA. (B and C) HEK293 cells expressing pEGFP/hnRNPK (B) and pEGFP/hnRNPK:mQRE (C) were transfected with pcDNA or the indicated myc-QKI isoform. After 48 h, the cells were lysed and 10% of the fraction was used as input, while the remaining cellular extracts were immunoprecipitated (IP) with the anti-Myc antibody. The bound RNAs were purified and detected by semiquantitative RT-PCR to visualize the presence of the indicated RNAs. The samples were analyzed in the presence (+) or absence (−) of reverse transcriptase (RT) as indicated. The size of the DNA fragments is shown in base pairs on the right. (D) Cross-linked U343 cells were immunoprecipitated with either control IgG or anti-QKI-5 antibodies. The bound RNAs were isolated, and qRT-PCR was used to determine levels of bound pri-miR-7-1 or control mRNAs for GAPDH and HPRT.
Fig 6
Fig 6
The QKI isoforms reduce pri-miR-7-1 processing by Drosha. (A) Cell lysates prepared from U343 cells transfected with siCTL, siQKI, or siDrosha and immunoblotted with anti-pan-QKI, anti-Drosha, or antitubulin antibodies. The migration of the molecular mass markers is shown on the left. (B) Cell lysates prepared from U343 cells transfected with siCTL, siQKI, or siDrosha were immunoprecipitated with anti-Drosha or IgG antibodies. The bound RNA was purified, and pri-miR-7-1 was detected by real-time qRT-PCR. (C) Fluorescence in situ hybridization performed using antisense pri-miR-7-1 as a probe on siCTL- or siQKI-transduced U343 cells. The nuclei were stained with 4′,6-diamidino-2-phenylindole (DAPI), and the images were merged.
Fig 7
Fig 7
QKI-deficient U343 cells have reduced EGFR expression, reduced EGF-dependent ERK activation, and reduced cell proliferation. U343 cells were transfected with 40 nM synthetic small RNAs: mimic miR negative control (miR CTL), mimic miR-7 (miR-7), siLuciferase (siCTL), and two siQKI siRNAs (siQKI-1 and siQKI-2), as described in Materials and Methods. In the rescue experiment, 100 nM miR-7 inhibitor or inhibitor control was cotransfected with the indicated siRNAs. (A) The cells were harvested at 48 h after transfection, and the total cell lysates were subjected to immunoblotting with anti-EGFR, anti-pan-QKI, and anti-β-tubulin antibodies as indicated. (B) The cells were starved overnight 48 h after transfection and then stimulated with 20 ng/ml of EGF for 15 min (+) or left untreated (−). Protein extracts were prepared, and pERK1/2, total ERK, and β-tubulin were detected by immunoblotting. (C) The cells were counted every 24 h after transfection using the Beckman Coulter Z2 cell counter. The cell numbers were normalized by the number of cells used for the transfection (day 0; between 190,000 and 260,000 cells). Two independent experiments were performed in duplicate. The data were expressed as averages ± standard deviations. **, P < 0.01; ***, P < 0.001 (Student t test). (D) The cells were photographed 48 h after transfection. The experiments were performed twice; one representative image is shown. (E) The cells were labeled with 10 μM BrdU for 1 h at 48 h after transfection and then harvested and stained with fluorescein isothiocyanate (FITC)-conjugated anti-BrdU antibody (green, FL1) and propidium iodide (red, FL2). The cell cycle was analyzed using FACS Calibur flow cytometry. Two independent experiments were performed; one representative FACS graph is shown. The averaged percentage of BrdU-positive cells was calculated from the two experiments. The FACS histograms and the percentage of cells at G0/G1, S, and G2/M phases are presented in Fig. S5 in the supplemental material.

Similar articles

Cited by

References

    1. Bartel DP. 2009. MicroRNAs: target recognition and regulatory functions. Cell 136:215–233 - PMC - PubMed
    1. Mendell JT, Olson EN. 2012. MicroRNAs in stress signaling and human disease. Cell 148:1172–1187 - PMC - PubMed
    1. van Kouwenhove M, Kedde M, Agami R. 2011. MicroRNA regulation by RNA-binding proteins and its implications for cancer. Nat. Rev. Cancer 11:644–656 - PubMed
    1. Denli AM, Tops BB, Plasterk RH, Ketting RF, Hannon GJ. 2004. Processing of primary microRNAs by the Microprocessor complex. Nature 432:231–235 - PubMed
    1. Gregory RI, Yan KP, Amuthan G, Chendrimada T, Doratotaj B, Cooch N, Shiekhattar R. 2004. The Microprocessor complex mediates the genesis of microRNAs. Nature 432:235–240 - PubMed

Publication types

MeSH terms