. 2013 Mar;33(6):1198-209.
doi: 10.1128/MCB.01054-12. Epub 2013 Jan 14.

FOSL1 controls the assembly of endothelial cells into capillary tubes by direct repression of αv and β3 integrin transcription

Affiliations

FOSL1 controls the assembly of endothelial cells into capillary tubes by direct repression of αv and β3 integrin transcription

Sandrine Evellin et al. Mol Cell Biol. 2013 Mar.

Abstract

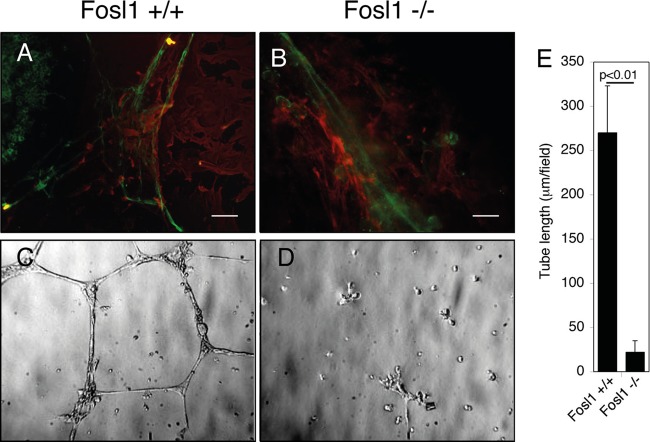
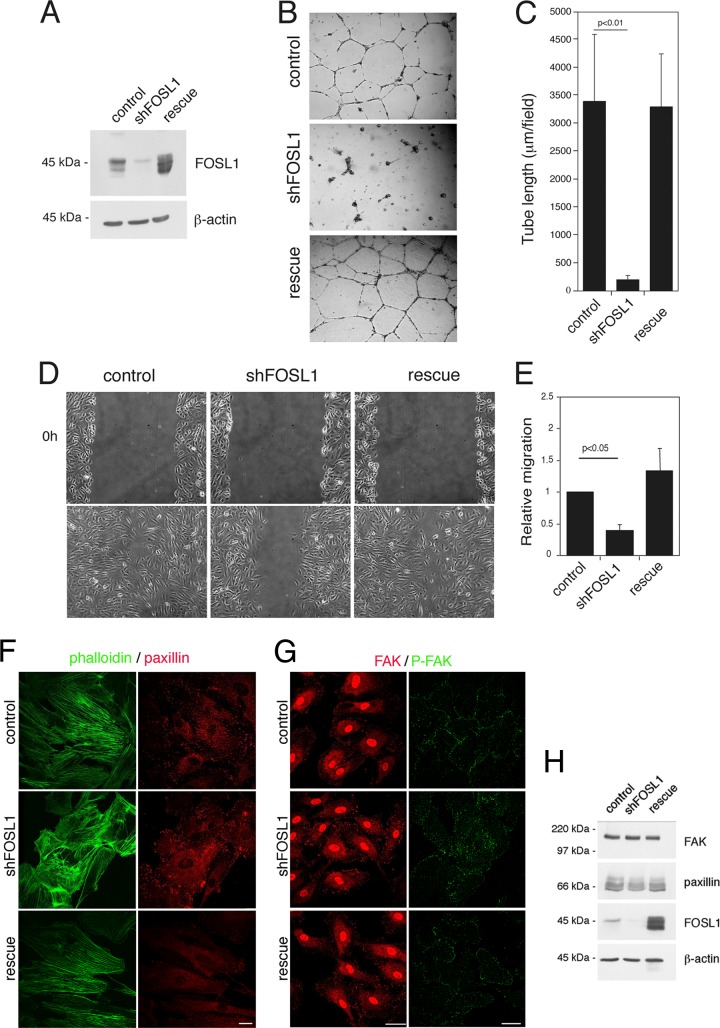
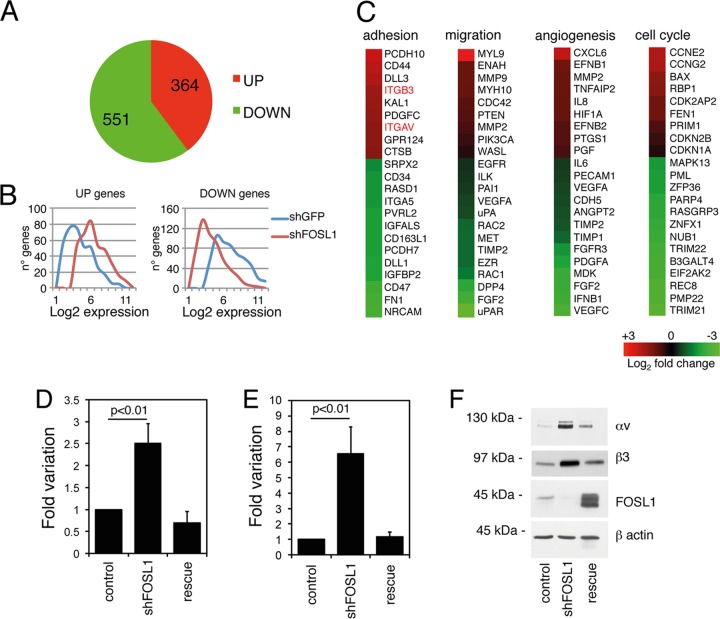
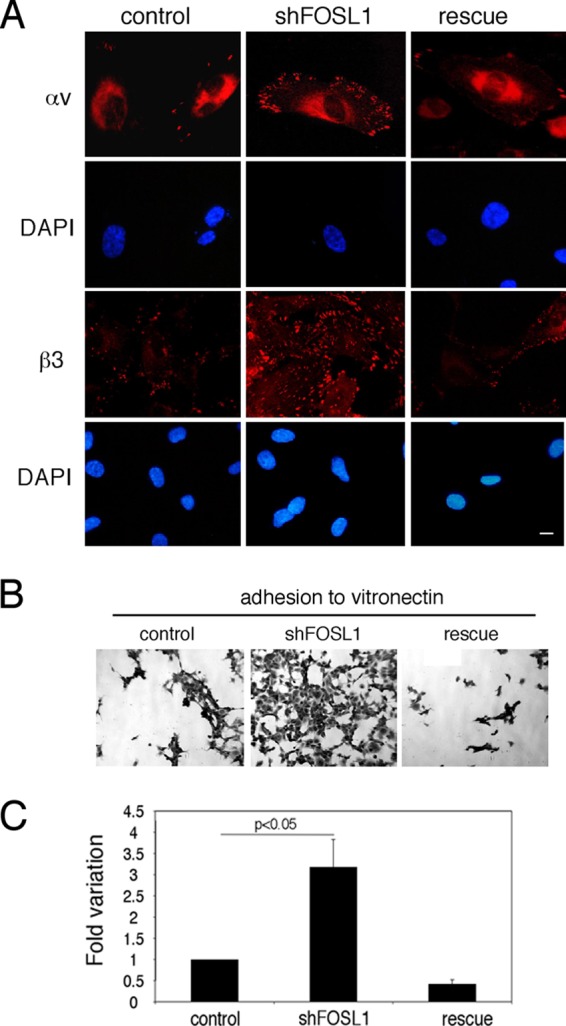
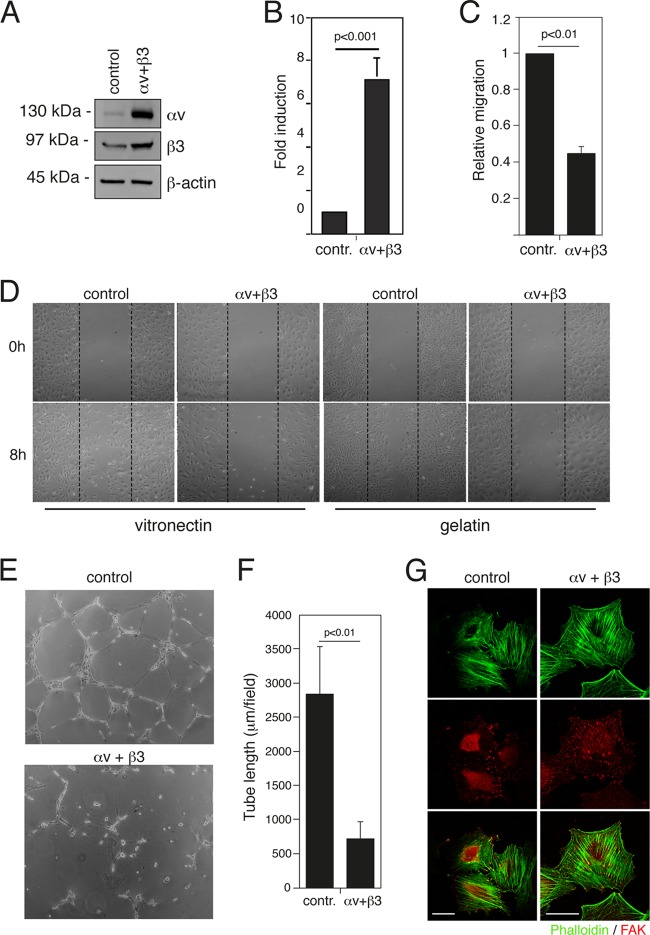
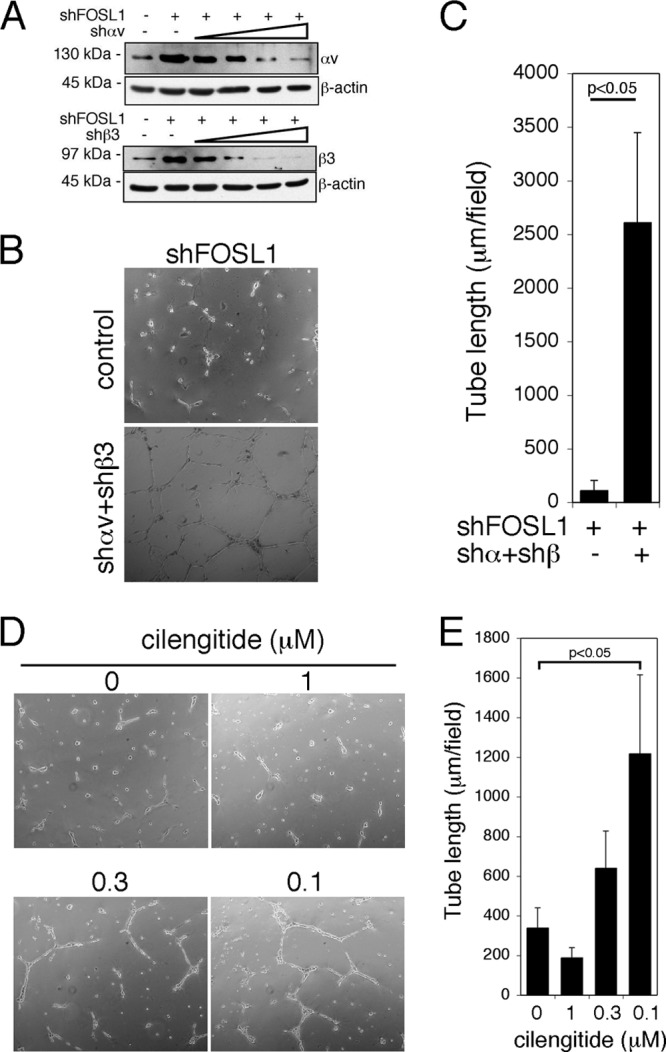
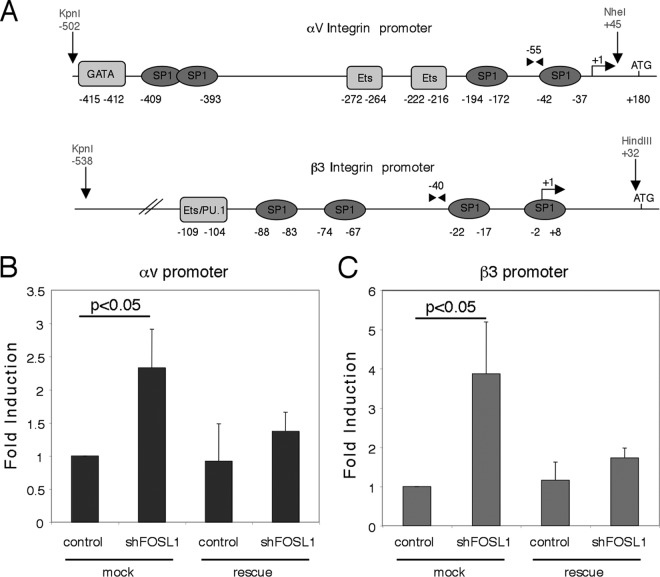
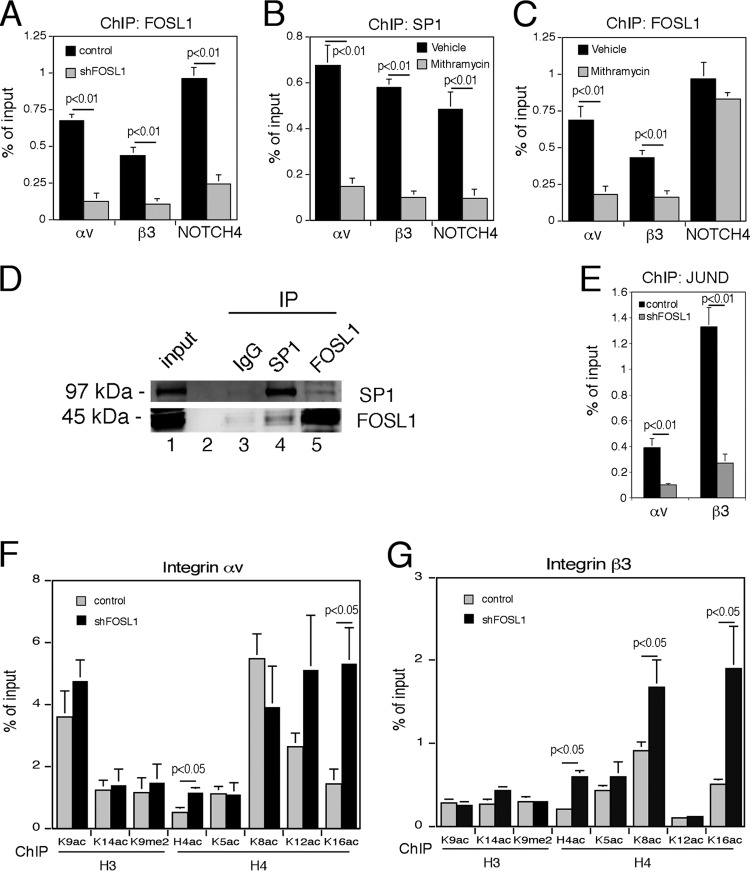
To form three-dimensional capillary tubes, endothelial cells must establish contacts with the extracellular matrix that provides signals for their proliferation, migration, and differentiation. The transcription factor Fosl1 plays a key role in the vasculogenic and angiogenic processes as Fosl1 knockout embryos die with vascular defects in extraembryonic tissues. Here, we show that Fosl1(-/-) embryonic stem cells differentiate into endothelial cells but fail to correctly assemble into primitive capillaries and to form tube-like structures. FOSL1 silencing affects in vitro angiogenesis, increases cell adhesion, and decreases cell mobility of primary human endothelial cells (HUVEC). We further show that FOSL1 is a repressor of αv and β3 integrin expression and that the down-modulation of αvβ3 rescues the angiogenic phenotype in FOSL1-silenced HUVEC, while the ectopic expression of αvβ3 alone reproduces the phenotypic alterations induced by FOSL1 knockdown. FOSL1 represses the transcription of both αv and β3 integrin genes by binding together with JunD to their proximal promoter via the transcription factor SP1. These data suggest that FOSL1-dependent negative regulation of αvβ3 expression on endothelial cells is required for endothelial assembly into vessel structures.


Figures

Fig 1
Fig 1
Fosl1−/− ESC differentiating into endothelial cells do not assemble correctly with smooth muscle cells. Indirect immunofluorescence analysis by double staining of endothelial and mural precursors is shown. Wild-type (A) and Fosl1−/− (B) ESC differentiated in the presence of VEGF-A for 5.5 days were stained for the EC markers platelet endothelial cell adhesion molecule 1 (PECAM-1; green) and α-SMA (red). The wild-type cells form a network of primitive capillary tubes, which start to be surrounded by smooth muscle cells, while Fosl1−/− cells are altered in their morphology and unable to organize into primitive capillary tubes. Scale bar, 15 μm. Wild-type (C) and Fosl1−/− (D) ECs were plated on Matrigel to test their in vitro angiogenesis ability (original magnification, ×100). (E) Quantification of tube length was performed based on the results shown in panels C and D. Fosl1 knockdown significantly affected tube formation. Data are presented as means ± SD from four different fields randomly chosen from each group from three sets of experiments.
Fig 2
Fig 2
FOSL1 silencing affects migration and organization of endothelial cells into capillary-like structures. HUVEC were infected with lentiviral vectors expressing unrelated (control) or FOSL1 shRNA (shFOSL1). FOSL1-silenced HUVEC were infected with a viral vector expressing an shRNA-resistant FOSL1 mutant (rescue). (A) FOSL1 expression was analyzed by Western blotting, and β-actin was used to verify equal loading. (B) Representative images of infected primary endothelial cells plated on BD Matrigel and incubated in complete medium for 20 h for in vitro angiogenesis assays (original magnification, ×40). (C) Quantification of tube length was performed based on the results shown in panel B. FOSL1 knockdown significantly affected tube formation. Data are presented as means ± SD from four different fields randomly chosen from each group from three sets of experiments (n = 3). (D) FOSL1 silencing reduced HUVEC migration in wound-healing migration assays. Infected HUVEC monolayers were wounded with a sterile pipette tip, washed with culture medium, and incubated in complete medium. Cells were observed under a light microscope and photographed initially and after 6 h (original magnification, ×100). (E) Migration assay. Cells were seeded in the upper wells of a 48-well microchemotaxis Boyden chamber. The lower wells contained 10 ng/ml VEGF-A. Cells migrating through a polycarbonate filter were quantified by staining the cells with hematoxylin-eosin solution. The results are expressed as the means ± SD of three independent experiments performed in triplicate. (F) HUVEC expressing a control shRNA, shFOSL1, or FOSL1 silencing vector together with an shRNA-resistant FOSL1 were fixed and stained for phalloidin and paxillin. FOSL1 silencing affected the distribution of focal adhesion. Scale bar, 25 μm. (G) HUVEC expressing a control shRNA, shFOSL1, or FOSL1 silencing vector together with an shRNA-resistant FOSL1 were fixed and stained for FAK and phospho-Y925 FAK as indicated. FOSL1 silencing affected the distribution of focal adhesion. Scale bar, 40 μm. (H) Western blot analysis of protein extracts, which shows no differences in paxillin or P∼Y925 FAK protein levels upon FOSL1 silencing.
Fig 3
Fig 3
FOSL1 is a negative regulator of the expression of integrin αv and β3. (A) Pie chart of microarray analysis showing genes differentially expressed following FOSL1 silencing in HUVEC. (B) Average levels of expression of genes upregulated and downregulated by FOSL1 silencing in HUVEC. (C) Heat map of microarray analysis showing genes up- and downregulated following FOSL1 silencing in HUVEC. Integrin αv and β3 genes are identified in red. (D and E) Expression levels of integrin αv and β3 mRNAs, respectively, were analyzed by RT-qPCR. Results were normalized to glyceraldehyde-3-phosphate dehydrogenase mRNA. Mean values from three independent experiments are shown with standard deviations. (F) Western blot analysis of the expression of integrins αv and β3 and FOSL1 in cells silenced for FOSL1 and in FOSL1-silenced HUVEC infected with a viral vector expressing an shRNA-resistant FOSL1 mutant (rescue). β-Actin was used to verify equal loading.
Fig 4
Fig 4
FOSL1 downregulation increases integrin expression on the cell surface and cell adhesion. (A) HUVEC silenced for FOSL1 (shFOSL1) exhibited increased numbers of focal adhesion plaques containing αvβ3. Cell staining of integrins αv and β3 in HUVEC silenced for FOSL1 and in FOSL1-silenced cells infected with a viral vector expressing an shRNA-resistant FOSL1 mutant (rescue) is shown. Scale bar, 10 μm. DAPI (4′,6′-diamidino-2-phenylindole) was used for nuclear staining. (B) HUVEC adhesion to vitronectin-coated filters (original magnification, ×40). (C) Quantification of cell adhesion measured by crystal violet staining. Data are presented as OD values of independent experiments ± SD (n = 3).
Fig 5
Fig 5
Overexpression of integrin αv and β3 subunits increases adhesion and affects migration of endothelial cells. (A) Total cell extracts of HUVEC expressing either GFP (control) or integrin αv and β3 subunits were analyzed by Western blotting using specific antibodies. (B) HUVEC as described in panel A were plated on vitronectin, and adhesion was measured as described in Materials and Methods. Results are given as OD values of crystal violet-stained cells and represent the mean of independent experiments ± SD (n = 3). (C) Migration assay performed in Boyden chambers as described in the legend of Fig. 2E. The results are expressed as the means ± SD of three independent experiments performed in triplicate. (D) HUVEC as described in panel A were wounded with a sterile pipette tip, washed with culture medium, and incubated in complete medium on vitronectin or gelatin-coated plates as indicated. Cells were observed under a light microscope and photographed at 0 and 8 h. A representative experiment is shown (original magnification, ×50). (E) HUVEC as described in panel A were plated on BD Matrigel and incubated in complete medium for 20 h for in vitro angiogenesis assays. (F) Quantification of tube length was performed based on the results shown in panel E. Data are presented as means ± SD from four different fields randomly chosen from each group from three sets of experiments. (G) HUVEC as described in panel A were stained for phalloidin (green) and FAK (red). Scale bar, 30 μm.
Fig 6
Fig 6
Integrin αv and β3 down-modulation rescues the ability of HUVEC silenced for FOSL1 to form vascular capillary networks on Matrigel. (A) FOSL1-silenced HUVEC were infected with increasing amounts of lentiviral vectors expressing integrin αv and β3 shRNAs (shαv and shβ3) as indicated. Integrin expression was analyzed by Western blotting. β-Actin was used to verify equal loading. (B) HUVEC, with integrin down-modulation to levels comparable to the endogenous wild type by lentiviral silencing, were plated on BD Matrigel for in vitro angiogenesis assays (original magnification, ×40). (C) Tube length quantification was performed based on the results shown in panel B. Data are presented as mean ± SD from four different fields randomly chosen from each group from three independent sets of experiments. (D) HUVEC silenced for FOSL1 were plated on BD Matrigel and incubated in complete medium in the presence of cilengitide at different concentrations. Inhibition of αvβ3 interaction with the ECM by cilengitide at low doses partially restored the tube formation on Matrigel impaired by FOSL1 silencing. (E) Tube length quantification was performed based on the results shown in panel. Data are presented as means ± SD from four different fields randomly chosen from each group from three independent sets of experiments.
Fig 7
Fig 7
FOSL1 is a negative regulator of integrin αv and β3 subunit gene transcription. (A) Schematic representation of the human integrin αv and β3 promoter regions. Numbers shown refer to the distance from the transcription start site. The putative SP1 sites are indicated by ovals; other putative binding sites are represented as rectangles. The nucleotide positions indicate the genomic region cloned upstream of the luciferase reporter gene in the pGL3 plasmid; the restriction sites used are indicated. Arrowheads indicate the locations of the oligonucleotides used for the ChIP assay. (B) Reporter constructs carrying the αv and β3 promoters were cotransfected in HUVEC together with shGFP (control), an shFOSL1-expressing plasmid, or shFOSL1 together with the shRNA-resistant FOSL1 (rescue). Promoter activity values were normalized using Renilla activity, and fold induction was calculated with respect to transfected control samples. Mean values for three experiments ± standard deviations of the means are shown.
Fig 8
Fig 8
FOSL1 regulates the integrin αv and β3 promoters indirectly through SP1. (A) Chromatin immunoprecipitation of FOSL1 on αv and β3 and NOTCH4 promoters. FOSL1 silencing (shFOSL1) significantly reduced the signal on all three promoters. Primer positions for the amplification of αv and β3 promoters are reported in Fig. 7A. Amplification of the NOTCH4 promoter region, which is bound by both FOSL1 (directly through an AP-1 binding site) and SP1, was used as a control. (B) Chromatin immunoprecipitation of SP1 on αv and β3 and NOTCH4 promoters. Cell treatment with mithramycin A for 2 h strongly inhibited SP1 binding to all three promoters. (C) Chromatin immunoprecipitation of FOSL1 on αv and β3 and NOTCH4 promoters in cells untreated (Vehicle) or treated with mithramycin A for 2 h. Mithramycin A inhibited the binding of FOSL1 on the on αv and β3 promoters but not the NOTCH4 promoter where FOSL1 binds directly to an AP-1 site. (D) Nuclear extracts obtained from HUVEC were either immunostained (Input) or subjected to immunoprecipitation (IP) with anti-FOSL1 or anti-SP1 antibodies as indicated. (E) Chromatin immunoprecipitation of JunD on αv and β3 promoters. FOSL1 silencing significantly reduced the JunD association on both promoters. (F and G) Chromatin immunoprecipitation analysis of histone modifications on αv and β3 promoters in control cells and in FOSL1-silenced cells. FOSL1 silencing induces a significant increase of H4ac at K16. Mean values from three independent experiments are shown with standard deviations.

Similar articles

Cited by

References

    1. Malinin NL, Pluskota E, Byzova TV. 2012. Integrin signaling in vascular function. Curr. Opin. Hematol. 19: 206– 211 - PMC - PubMed
    1. Bader BL, Rayburn H, Crowley D, Hynes RO. 1998. Extensive vasculogenesis, angiogenesis, and organogenesis precede lethality in mice lacking all alpha v integrins. Cell 95: 507– 519 - PubMed
    1. Drake CJ, Cheresh DA, Little CD. 1995. An antagonist of integrin alpha v beta 3 prevents maturation of blood vessels during embryonic neovascularization. J. Cell Sci. 108: 2655– 2661 - PubMed
    1. Stupack DG, Cheresh DA. 2004. Integrins and angiogenesis. Curr. Top. Dev. Biol. 64: 207– 238 - PubMed
    1. Soldi R, Mitola S, Strasly M, Defilippi P, Tarone G, Bussolino F. 1999. Role of αvβ3 integrin in the activation of vascular endothelial growth factor receptor-2. EMBO J. 18: 882– 892 - PMC - PubMed

Publication types

MeSH terms