. 2013 Mar;12(3):764-80.
doi: 10.1074/mcp.M112.024307. Epub 2013 Jan 14.

The proteomic investigation of chromatin functional domains reveals novel synergisms among distinct heterochromatin components

Affiliations

The proteomic investigation of chromatin functional domains reveals novel synergisms among distinct heterochromatin components

Monica Soldi et al. Mol Cell Proteomics. 2013 Mar.

Abstract

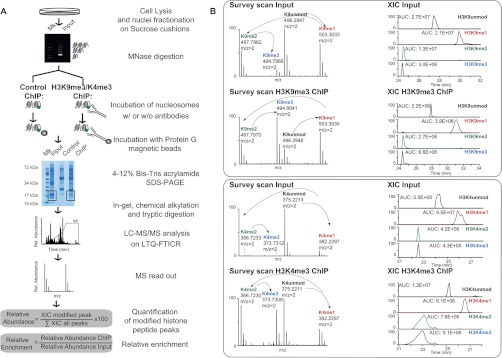
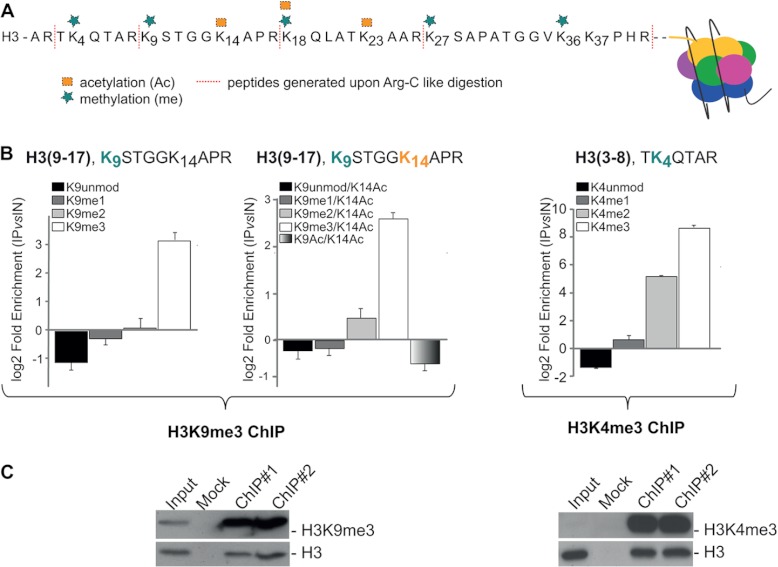
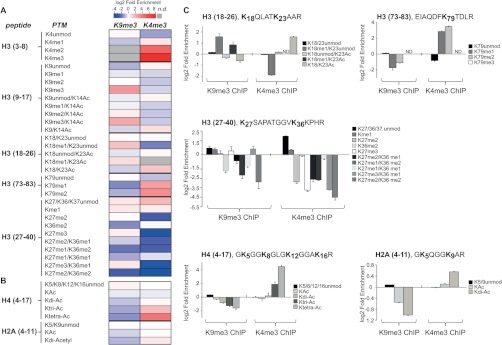
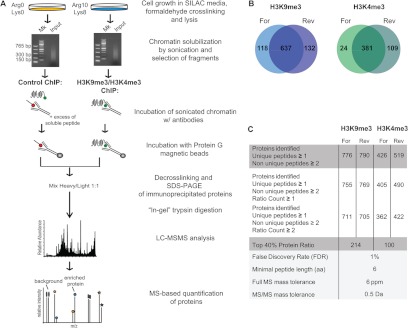
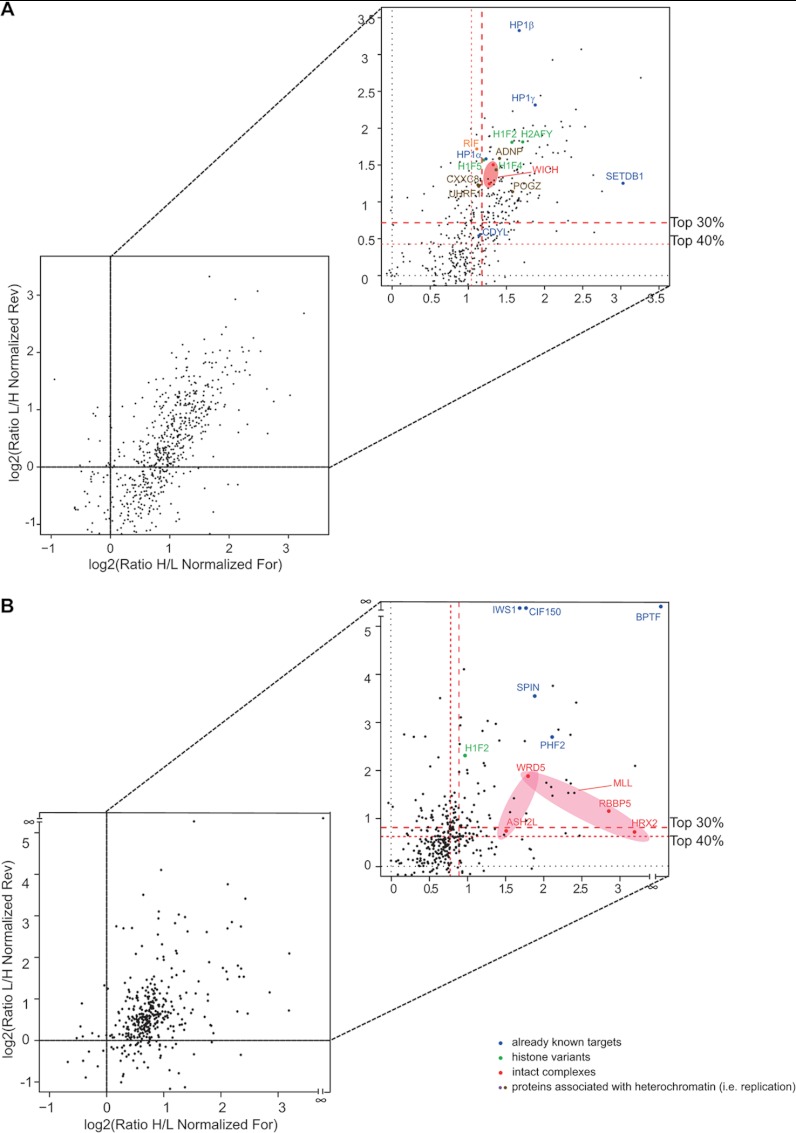
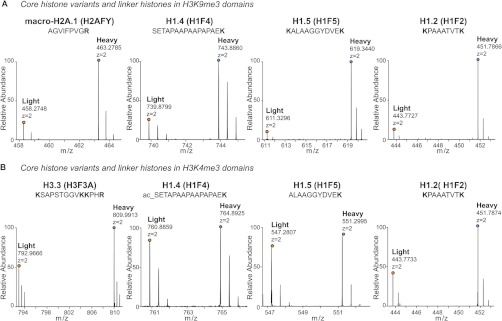
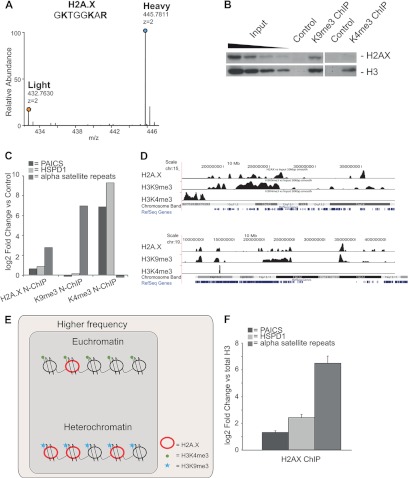
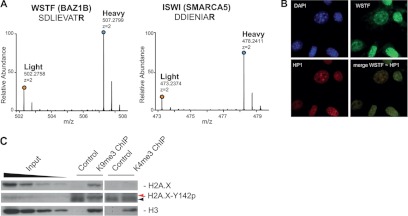
Chromatin is a highly dynamic, well-structured nucleoprotein complex of DNA and proteins that controls virtually all DNA transactions. Chromatin dynamicity is regulated at specific loci by the presence of various associated proteins, histones, post-translational modifications, histone variants, and DNA methylation. Until now the characterization of the proteomic component of chromatin domains has been held back by the challenge of enriching distinguishable, homogeneous regions for subsequent mass spectrometry analysis. Here we describe a modified protocol for chromatin immunoprecipitation combined with quantitative proteomics based on stable isotope labeling by amino acids in cell culture to identify known and novel histone modifications, variants, and complexes that specifically associate with silent and active chromatin domains. Our chromatin proteomics strategy revealed unique functional interactions among various chromatin modifiers, suggesting new regulatory pathways, such as a heterochromatin-specific modulation of DNA damage response involving H2A.X and WICH, both enriched in silent domains. Chromatin proteomics expands the arsenal of tools for deciphering how all the distinct protein components act together to enforce a given region-specific chromatin status.


Figures

Fig. 1.
Fig. 1.
Scheme of N-ChroP strategy combining N-ChIP and MS analysis. A, scheme of the experimental approach. B, zoomed mass spectra and extracted ion chromatograms (XICs) constructed at the corresponding m/z value of the 2+ charge unmodified, mono-, di-, and trimethylated K9 (upper panel) and K4 (lower panel), for both input and ChIP. (See also supplemental Fig. S1.)
Fig. 2.
Fig. 2.
Estimation of H3K9me3 and H3K4me3 enrichment in the corresponding ChIPs. A, schematic representation of the H3 N-terminal tail, with annotated modification and the peptides produced upon D6-acetic anhydride alkylation followed by in-gel trypsin digestion. Symbols and colors used to annotate different modifications are in the legend. B, relative enrichment of methylations on K9 (co-existing or not with acetylated K14) and on K4 in peptides spanning regions 9–17 and 3–8 of H3 upon N-ChIP using anti-H3K9me3 and anti-H3K4me3 antibodies, respectively. The enrichment is expressed as a log2 ratio of the relative abundance of each methylation in the ChIP sample as compared with the input and represents the averages ± S.E. (standard error of the mean) from three independent experiments. C, WB validation of H3K9me3 and H3K4me3 enrichment in the corresponding ChIPs: aliquots of ChIPed material and of input were loaded on SDS-PAGE and immunoblotted with antibodies H3K9me3 and H3K4me3 (#1 and #2 indicate two replicates). 0.2% and 0.04% of input were loaded for H3K9me3 and H3K4me3, respectively, for a semi-quantitative comparison with immunoprecipitation, using H3 as loading control for normalization. (See also supplemental Figs. S2 and S10.)
Fig. 3.
Fig. 3.
Relative enrichment of modifications in H3K9me3 and H3K4me3 mono-nucleosome. Heatmap of hPTM enrichment for all the modified resides identified on H3 (A), H4, and H2A histones (B). Each row corresponds to a distinct histone modification, and columns correspond to the different antibodies used for the ChIP (n.d., not detected). C, the relative enrichment of each modification is expressed as a log2 ratio between its relative abundance in the immunopurified nucleosomes and that in the input for histone H3, H4, and H2A peptides. Histograms represent the averages ± S.E. (standard error of the mean) from three independent experiments. (See also supplemental Figs. S3, S4, S5, and S10.)
Fig. 4.
Fig. 4.
Scheme of the X-ChroP strategy combining X-ChIP and SILAC quantitation. A, scheme of the experimental approach. B, Venn diagrams show the overlap of identified and quantified (ratio count ≥ 1) proteins in two experimental replicates of ChIPs for the modification of interest: H3K9me3 (left) and H3K4me3 (right). C, table summarizing features of identified and quantified proteins for H3K9me3 and H3K4me3 X-ChIPs (For = forward, Rev = reverse). (See also supplemental Fig. S6.)
Fig. 5.
Fig. 5.
The heterochromatomes and euchromatomes identified via X-ChroP. Proteins are plotted by their SILAC ratios in the first (x-axis) and second (y-axis) SILAC experiments for H3K9me3 (A) and H3K4me3 (B) (For = forward, Rev = reverse). Specific interactors should lie in the upper right-hand quadrant (enlarged), close to the diagonal. Red dotted lines represent the cutoffs, selecting the top 40% and 30% of protein ratios. Already annotated specific interactors are highlighted in color. (See also supplemental Tables S1 and S2 and supplemental Fig. S7.)
Fig. 6.
Fig. 6.
Histone variants enriched in heterochromatin and euchromatin. A, mass spectra of light and heavy SILAC peak pairs from H2AFY, H1.4, H1.5, and H1.2 demonstrating the specific enrichment of these proteins in the K9me3 ChIPed material (heavy) relative to the mock control (light). B, mass spectra of light and heavy SILAC peak pairs from H3.3, H1.4, H1.5, and H1.2 demonstrating the enrichment of these variants in the K4me3 ChIPed material relative to the mock control. (See also supplemental Fig. S8.)
Fig. 7.
Fig. 7.
H2A.X variant is overrepresented in heterochromatin. A, mass spectra of light and heavy SILAC peak pairs from H2A.X in the forward H3K9me3 X-ChIP: an H/L ratio > 1 indicates specific enrichment of this protein. B, Western blot of unmodified H2A.X upon ChIP with α-K9me3 and α-K4me3. Unmodified H3 is the loading control. C, qPCR measurement of α-satellite repeats in H2A.X, H3K9me3, and H3K4me3 domains immunopurified via the N-ChIP strategy relative to the mock control. The euchromatic actively transcribed genes PAICS and HSPD1 were used as negative controls. D, ChIP-Seq profiles of H2A.X, H3K9me3, and H3K4me3 compared with the input across regions of human chromosomes 15 (chr15: 15,396,089–38,421,489) and 19 (chr19: 6,465,305–41,462,000). E, model of higher local density of H2A.X in heterochromatin. F, qPCR measures of α-satellite repeats and genes PAICS and HSPD1 in H2A.X ChIP over total H3. Bars in the graph represent the averages ± S.E. (standard error of the mean) from three replicates. (See also supplemental Fig. S9.)
Fig. 8.
Fig. 8.
WICH and H2A.X Tyr142p involvement in heterochromatin. A, mass spectra of light and heavy SILAC peak pairs from WSTF and ISWI; H/L ratios > 1 indicate specific enrichment of these proteins. B, WSTF co-localizes with HP1β, a marker of pericentromeric heterochromatin (merge) (1 pixel = 0.172 μm; original magnification = 60×). C, WB of unmodified H2A.X and H2A.X-Tyr142p (red arrow) upon ChIP with α-K9me3 and α-K4me3. Unmodified H3 is the loading control. Black arrow indicates an unspecific band at lower molecular weight, also detected in the control.

Similar articles

Cited by

References

    1. Kornberg R. D. (1974) Chromatin structure: a repeating unit of histones and DNA. Science 184, 868–871 - PubMed
    1. Luger K., Mader A. W., Richmond R. K., Sargent D. F., Richmond T. J. (1997) Crystal structure of the nucleosome core particle at 2.8 A resolution. Nature 389, 251–260 - PubMed
    1. Waddington C. H. (2011) The epigenotype. 1942. Int. J. Epidemiol. 41, 10–13 - PubMed
    1. Berger S. L., Kouzarides T., Shiekhattar R., Shilatifard A. (2009) An operational definition of epigenetics. Genes Dev. 23, 781–783 - PMC - PubMed
    1. Spotswood H. T., Turner B. M. (2002) An increasingly complex code. J. Clin. Invest. 110, 577–582 - PMC - PubMed

Publication types

MeSH terms