. 2013 Jul 15;133(2):346-56.
doi: 10.1002/ijc.28030. Epub 2013 Feb 13.

Establishment of tumor-specific copy number alterations from plasma DNA of patients with cancer

Affiliations
Free PMC article

Establishment of tumor-specific copy number alterations from plasma DNA of patients with cancer

Ellen Heitzer et al. Int J Cancer. .
Free PMC article

Abstract

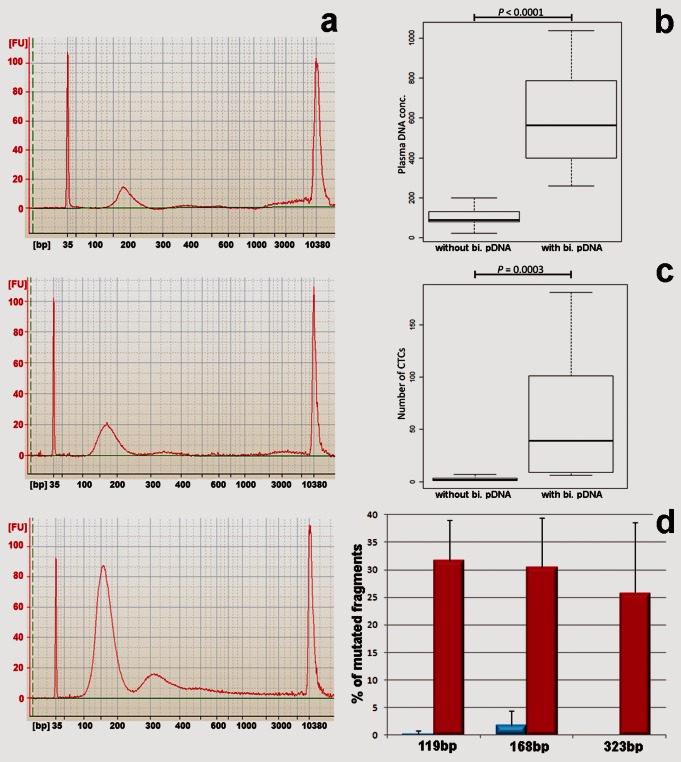
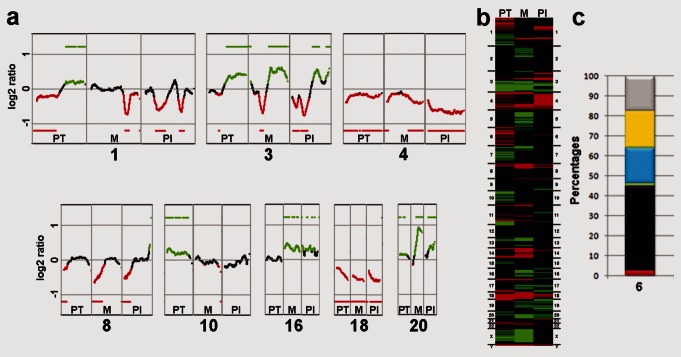
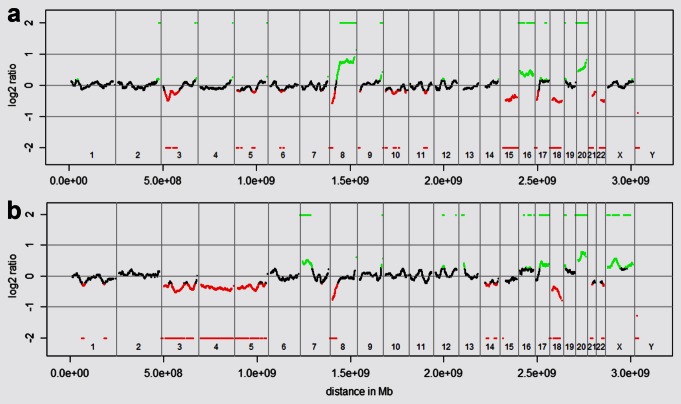
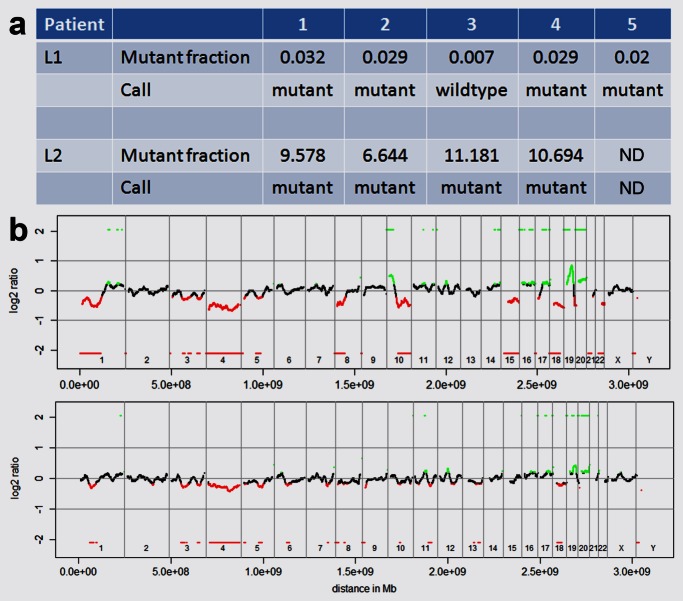
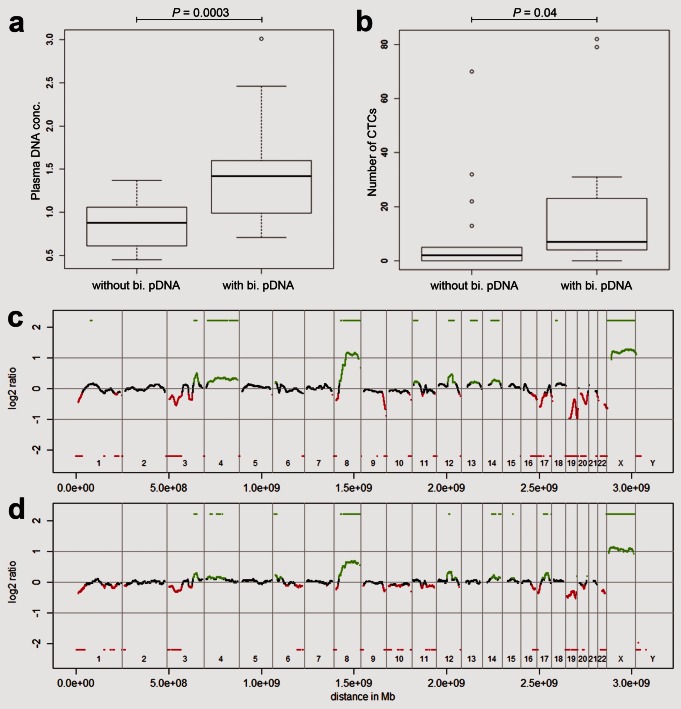
With the increasing number of available predictive biomarkers, clinical management of cancer is becoming increasingly reliant on the accurate serial monitoring of tumor genotypes. We tested whether tumor-specific copy number changes can be inferred from the peripheral blood of patients with cancer. To this end, we determined the plasma DNA size distribution and the fraction of mutated plasma DNA fragments with deep sequencing and an ultrasensitive mutation-detection method, i.e., the Beads, Emulsion, Amplification, and Magnetics (BEAMing) assay. When analyzing the plasma DNA of 32 patients with Stage IV colorectal carcinoma, we found that a subset of the patients (34.4%) had a biphasic size distribution of plasma DNA fragments that was associated with increased circulating tumor cell numbers and elevated concentration of mutated plasma DNA fragments. In these cases, we were able to establish genome-wide tumor-specific copy number alterations directly from plasma DNA. Thus, we could analyze the current copy number status of the tumor genome, which was in some cases many years after diagnosis of the primary tumor. An unexpected finding was that not all patients with progressive metastatic disease appear to release tumor DNA into the circulation in measurable quantities. When we analyzed plasma DNA from 35 patients with metastatic breast cancer, we made similar observations suggesting that our approach may be applicable to a variety of tumor entities. This is the first description of such a biphasic distribution in a surprisingly high proportion of cancer patients which may have important implications for tumor diagnosis and monitoring.


Figures

Figure 1
Figure 1
Characteristics of plasma DNA from healthy controls and patients with advanced-stage colorectal cancer (CRC). (a) Size distribution of plasma DNA fragments from a healthy donor (upper plot), Patient #11 (center plot) and Patient #22 (lower plot). Normalization was performed using two internal markers, visible as high, narrow amplitudes at Positions 35 and 10.380 bp, respectively. For each analysis, 800 pg of DNA was used. (b) Patients with a biphasic plasma DNA size distribution (with bi. pDNA) have higher plasma DNA concentrations compared to patients lacking the second peak (without bi. pDNA). (c) The occurrence and number of CTCs is closely correlated with a biphasic plasma DNA size distribution. (d) Deep sequencing using three different sequencing reaction sizes (i.e., 119, 168 and 323 bp) identified few mutated KRAS fragments in patients without a biphasic plasma DNA size distribution (blue), but high levels of mutated KRAS fragments in patients with a biphasic plasma DNA size distribution (red) (the errors bars represent SDs).
Figure 2
Figure 2
Heat maps of plasma DNA profiles from healthy controls and patients with advanced-stage colorectal cancer (CRC). (a) Heat map of plasma DNA profiles from healthy donors (black: balanced; red: under-represented; green: over-represented). As we used male reference DNA in all experiments, female plasma DNA samples have a relative over-representation of the X chromosome and an under-representation of the Y-chromosome (F1–F3), whereas male samples have balanced sex chromosomes (M1–M3). (b) Heat maps of six exemplary patients (#7, #11, #14, #24, #28 and # 37) that lack a biphasic plasma DNA size distribution. (c) Heat maps of plasma DNA from 10 patients (#6, #9, #10, #18, #20, #22, #25, #26, #27 and #33) that have a biphasic plasma DNA size distribution.
Figure 3
Figure 3
Comparison of copy number changes in the primary tumor, metastasis and plasma DNA of Patient #6. (a) Comparison of the ratio profiles of representative chromosomes (1, 3, 4, 8, 10, 16, 18 and 20; indicated by numbers below the copy number changes) between the primary tumor (PT, left column), metastasis (M, center column) and plasma DNA (Pl, right column). The single green and red bars summarize the regions that were gained or lost based on all iterative calculations of our algorithm (Supporting Information). The black profile regions represent balanced regions, lost regions appear in red and gained regions are shown as green (complete profiles are depicted in Supporting Information Fig. 1a). (b) Heat maps comparing the copy number changes in the primary tumor (PT), metastasis (M), and plasma DNA (Pl; Black: balanced regions; red: under-represented regions; green: over-represented regions). (c) The bar chart combines information on copy number changes and their occurrence in the primary tumor, metastasis and plasma DNA. It displays the percentages of chromosomal regions that were commonly lost (red), balanced (black) or gained (green) in all three samples, shared by metastasis and plasma DNA only (blue), shared by primary tumor and plasma DNA only (yellow) or unique to the plasma DNA (gray).
Figure 4
Figure 4
Array-CGH from two cases where only small biopsies had been taken at the time of diagnosis, so insufficient material was available for further analyses. (a) The plasma DNA from Patient #18 revealed typical CRC-related copy number changes, such as loss on 8p and gains on 8q and 20. (b) Plasma DNA ratio profile from Patient #22 demonstrating losses on chromosomes 3, 4, 5, 8p and 18 and gains on chromosomes 7p, 17q and 20.
Figure 5
Figure 5
Summary of the BEAMing analysis and representative array-CGH profiles from one representative patient. (a) Mutant fraction and call (i.e., either mutant or wildtype) as established by BEAMing for two patients. (b) The upper panel illustrates the array-CGH profile of the primary tumor, the lower panel the corresponding profile established with plasma DNA from Day 3.
Figure 6
Figure 6
Evaluation of blood from 35 patients with breast cancer and representative array-CGH profiles. (a) Breast cancer patients with a biphasic plasma DNA size distribution (with bi. pDNA) have increased plasma DNA concentrations (here depicted as log10 ratio) compared to patients lacking the second peak (without bi. pDNA). (b) The number of CTCs is also increased in patients with a biphasic plasma DNA size distribution. (c) Array CGH profile of the primary tumor of breast cancer Patient #20. (d) Corresponding array-CGH profile obtained with plasma DNA from Patient #20, who had a biphasic plasma DNA size distribution.

References

    1. Walther A, Johnstone E, Swanton C, et al. Genetic prognostic and predictive markers in colorectal cancer. Nat Rev Cancer. 2009;9:489–99. - PubMed
    1. Leon SA, Shapiro B, Sklaroff DM, et al. Free DNA in the serum of cancer patients and the effect of therapy. Cancer Res. 1977;37:646–50. - PubMed
    1. Stroun M, Anker P, Maurice P, et al. Neoplastic characteristics of the DNA found in the plasma of cancer patients. Oncology. 1989;46:318–22. - PubMed
    1. Pinzani P, Salvianti F, Zaccara S, et al. Circulating cell-free DNA in plasma of melanoma patients: qualitative and quantitative considerations. Clin Chim Acta. 2010;412:2141–5. - PubMed
    1. Schwarzenbach H, Hoon DS, Pantel K. Cell-free nucleic acids as biomarkers in cancer patients. Nat Rev Cancer. 2011;11:426–37. - PubMed

Publication types

MeSH terms