

Association testing of the mitochondrial genome using pedigree data
- PMID: 23319385
- PMCID: PMC4171957
- DOI: 10.1002/gepi.21706
Association testing of the mitochondrial genome using pedigree data
Abstract
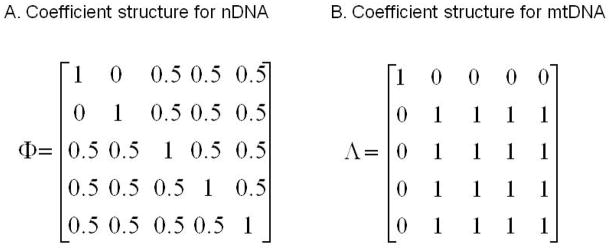
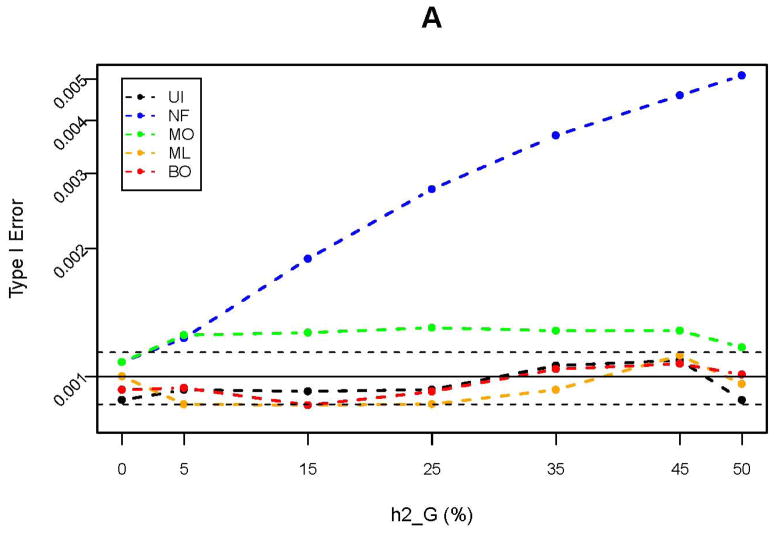
In humans, mitochondria contain their own DNA (mtDNA) that is inherited exclusively from the mother. The mitochondrial genome encodes 13 polypeptides that are components of oxidative phosphorylation to produce energy. Any disruption in these genes might interfere with energy production and thus contribute to metabolic derangement. Mitochondria also regulate several important cellular activities including cell death and calcium homeostasis. Aided by sharply declining costs of high-density genotyping, hundreds of mitochondrial variants will soon be available in several cohorts with pedigree structures. Association testing of mitochondrial variants with disease traits using pedigree data raises unique challenges because of the difficulty in separating the effects of nuclear and mitochondrial genomes, which display different modes of inheritance. Failing to correctly account for these effects might decrease power or inflate type I error in association tests. In this report, we sought to identify the best strategy for association testing of mitochondrial variants when genotype and phenotype data are available in pedigrees. We proposed several strategies to account for polygenic effects of the nuclear and mitochondrial genomes and we performed extensive simulation studies to evaluate type I error and power of these strategies. In addition, we proposed two permutation tests to obtain empirical P values for these strategies. Furthermore, we applied two of the analytical strategies to association analysis of 196 mitochondrial variants with blood pressure and fasting blood glucose in the pedigree rich, Framingham Heart Study. Finally, we discussed strategies for study design, genotyping, and data cleaning in association testing of mtDNA in pedigrees.
© 2013 Wiley Periodicals, Inc.
Conflict of interest statement
The authors declare that there is no conflict of interest.
Figures


References
-
- Benn M, Schwartz M, Nordestgaard BG, Tybjaerg-Hansen A. Mitochondrial haplogroups: ischemic cardiovascular disease, other diseases, mortality, and longevity in the general population. Circulation. 2008;117(19):2492–501. - PubMed
-
- Byrne EM, McRae AF, Duffy DL, Zhao ZZ, Martin NG, Whitfield JB, Visscher PM, Montgomery GW. Family-based mitochondrial association study of traits related to type 2 diabetes and the metabolic syndrome in adolescents. Diabetologia. 2009;52(11):2359–68. - PubMed
-
- Dawber TR, Kannel WB, Lyell LP. An approach to longitudinal studies in a community: the Framingham Study. Ann N Y Acad Sci. 1963;107:539–56. - PubMed
Publication types
MeSH terms
Substances
Grants and funding
LinkOut - more resources
Full Text Sources
Other Literature Sources
