. 2013 Mar;81(3):645-52.
doi: 10.1128/IAI.01278-12. Epub 2013 Jan 14.

Influenza-induced inflammation drives pneumococcal otitis media

Affiliations

Influenza-induced inflammation drives pneumococcal otitis media

Kirsty R Short et al. Infect Immun. 2013 Mar.

Abstract

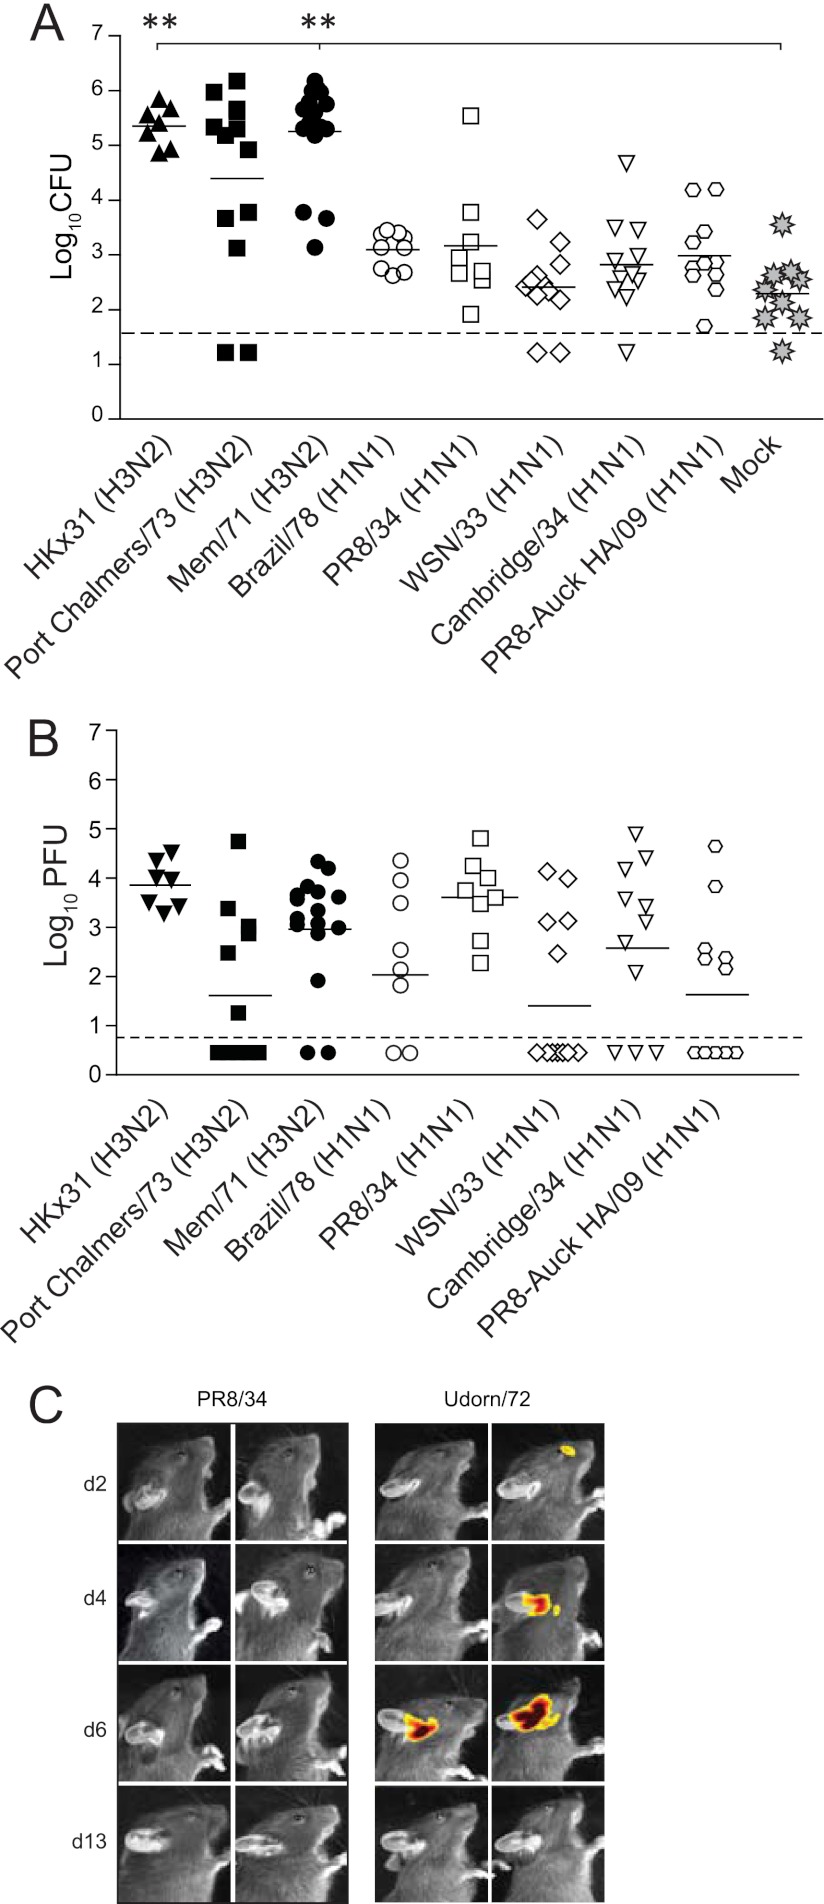
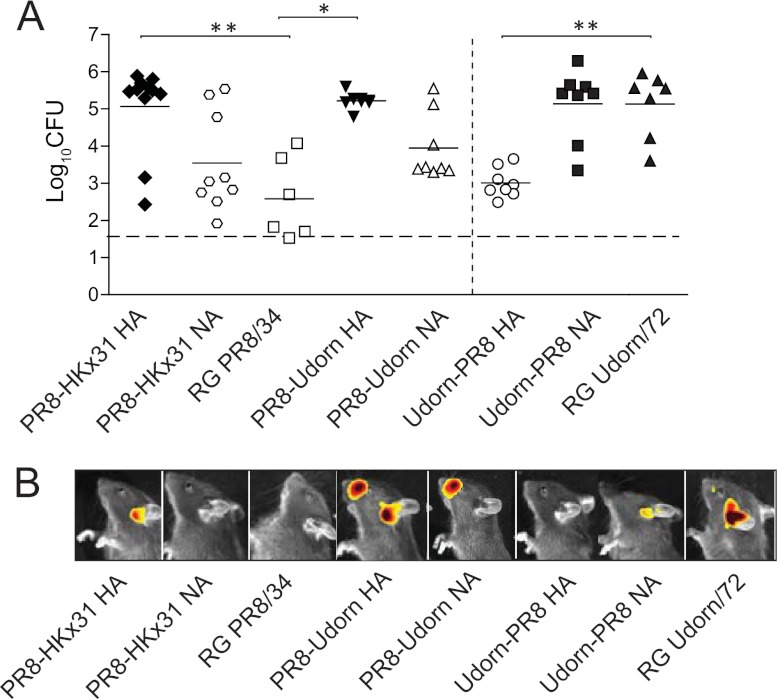
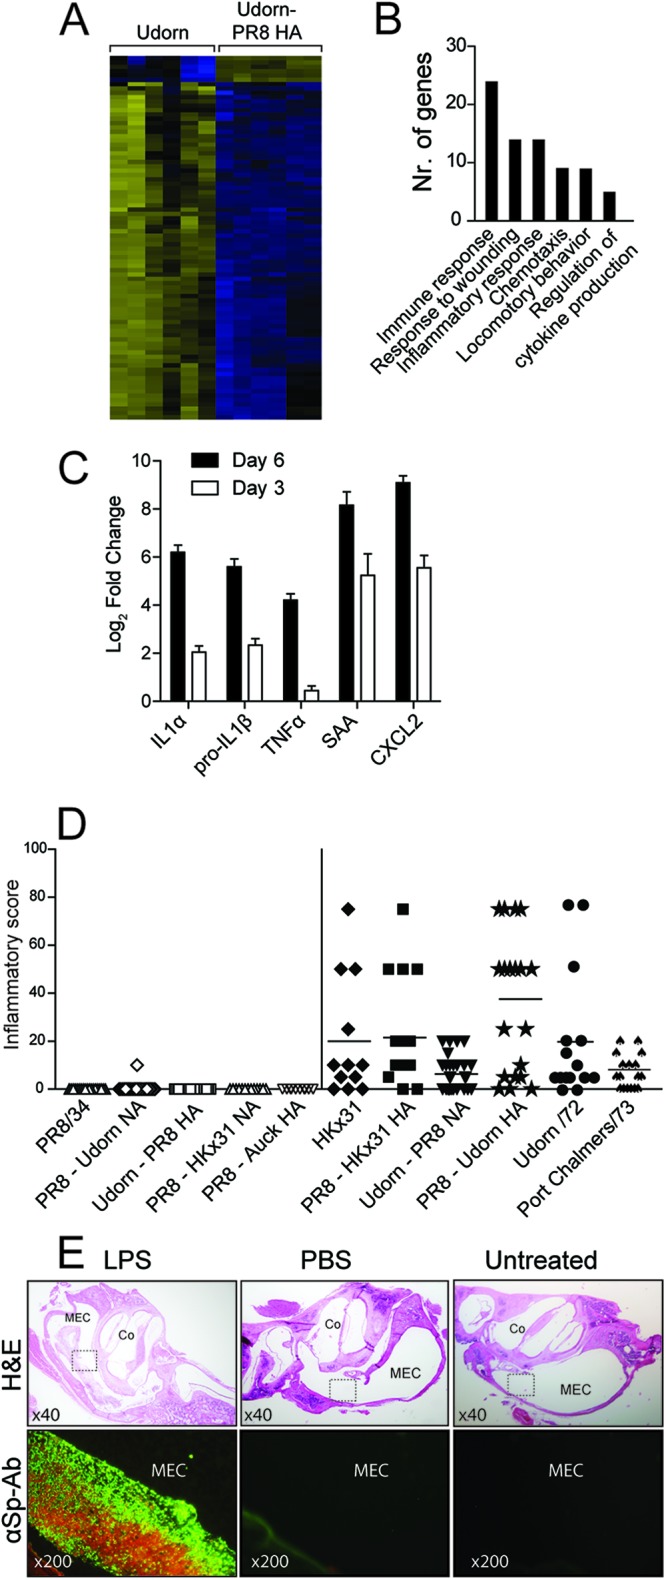
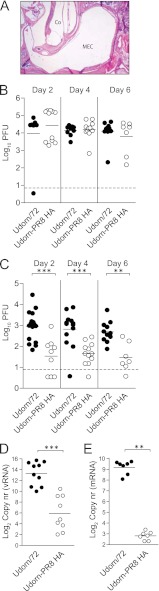
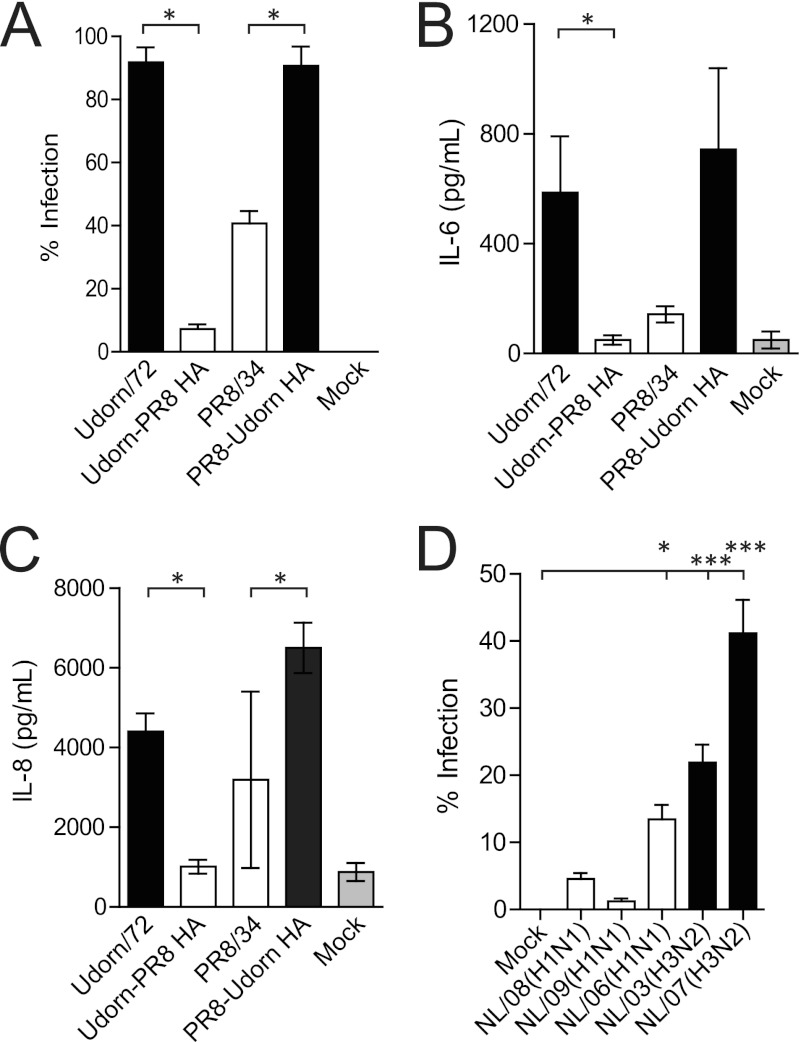
Influenza A virus (IAV) predisposes individuals to secondary infections with the bacterium Streptococcus pneumoniae (the pneumococcus). Infections may manifest as pneumonia, sepsis, meningitis, or otitis media (OM). It remains controversial as to whether secondary pneumococcal disease is due to the induction of an aberrant immune response or IAV-induced immunosuppression. Moreover, as the majority of studies have been performed in the context of pneumococcal pneumonia, it remains unclear how far these findings can be extrapolated to other pneumococcal disease phenotypes such as OM. Here, we used an infant mouse model, human middle ear epithelial cells, and a series of reverse-engineered influenza viruses to investigate how IAV promotes bacterial OM. Our data suggest that the influenza virus HA facilitates disease by inducing a proinflammatory response in the middle ear cavity in a replication-dependent manner. Importantly, our findings suggest that it is the inflammatory response to IAV infection that mediates pneumococcal replication. This study thus provides the first evidence that inflammation drives pneumococcal replication in the middle ear cavity, which may have important implications for the treatment of pneumococcal OM.


Figures

Fig 1
Fig 1
H3N2 viruses facilitate pneumococcal otitis media. (A) Titers of S. pneumoniae EF3030lux in the middle ears of mice 6 days after i.n. infection with different IAV strains. Bacterial counts are represented as the averages of titers derived from the left and right ears of each mouse. Statistical significance was determined using a Mann-Whitney U test and Bonferroni posttest and was analyzed only relative to mock-infected mice (rather than comparing all the different permutations of the relative treatment groups). Statistical significance is denoted by two asterisks (P < 0.01). Data are pooled from a minimum of two independent experiments. The dashed line indicates the detection limit of the assay. (B) Replication of different IAV strains in the nasal cavity. Mice were coinfected with S. pneumoniae EF3030lux and IAV, and IAV titers were assessed 6 days post-viral infection. Statistical significance was determined using a one-way analysis of variance (ANOVA) and Bonferroni posttest. Data are pooled from a minimum of two independent experiments. The dashed line indicates the detection limit of the assay. (C) Representative in vivo images of S. pneumoniae EF3030lux in the middle ears of mice at various days (d) after intranasal (i.n.) infection with IAV. A luminescent signal indicates the presence of live, actively replicating pneumococci at that site. The detection limit of in vivo imaging in the middle ear is approximately 103 CFU (16).
Fig 2
Fig 2
The H3 HA facilitates pneumococcal otitis media. (A) Titers of S. pneumoniae EF3030lux in the middle ears of mice 6 days after i.n. infection with different IAV strains. Bacterial counts are represented as the averages of titers derived from the left and right ears of each mouse. Statistical significance was determined using a Kruskal-Wallis test and Dunn's posttest relative to the relevant reverse genetics (RG) parental virus. Statistical significance is denoted by two asterisks (P < 0.01) or one asterisk (P < 0.05). Data are pooled from a minimum of two independent experiments. The dashed line indicates the detection limit, while solid lines indicate the mean values of the data. H3 viruses are shown in black, while H1 viruses are shown in white. (B) Representative in vivo images of S. pneumoniae EF3030lux in the middle ears of mice 6 days after intranasal (i.n.) infection with IAV. The detection limit of in vivo imaging in the middle ear is approximately 103 CFU (16).
Fig 3
Fig 3
Inflammation facilitates bacterial OM. (A) Heat map demonstrating differential gene expression in the middle ears of mice 6 days postinfection with Udorn/72 or Udorn PR8-HA. Upregulated genes are represented in yellow, downregulated genes are shown in blue, and black represents genes that were not differentially expressed. (B) Functional classification of genes upregulated in the middle ear of Udorn/72-infected mice relative to that of Udorn-PR8 HA-infected mice 6 days postinfection. (C) Fold increase in the expression of selected genes in the middle ear of Udorn/72-infected mice relative to that of Udorn-PR8 HA-infected mice 6 days postinfection by qPCR. Means ± standard errors of the means (SEM) are shown, where each bar represents a minimum of four data points. Data are normalized to glyceraldehyde-3-phosphate dehydrogenase (GAPDH) expression. SAA: serum amyloid A. (D) Middle ear inflammation observed by histology 6 days after infection with IAV. Inflammatory score data represent the percentage of the middle ear cavity with an inflammatory cell infiltrate, as previously published (15). Sections were scored by a pathologist blinded to the experimental design, and each data point represents a single ear from an infected mouse. Data are pooled from a minimum of two independent experiments. Data points in black indicate H3-bearing viruses, while data points in white indicate H1-bearing viruses. (E) Immunofluorescence using a FITC-labeled anti-S. pneumoniae antibody (αSp-Ab) on middle ear sections from mice colonized with S. pneumoniae and challenged transtympanically with LPS/PBS or left untreated. Hematoxolin and eosin (H&E) staining of the relevant sections is shown (upper panels). Boxes indicate the regions examined by immunofluorescence in the lower panels. Relevant image magnifications are shown. MEC, middle ear cavity; Co, cochlea.
Fig 4
Fig 4
Induction of middle ear inflammation by IAV reflects increased viral replication. (A) Representative image of middle ear sections stained with H&E (magnification, ×40). Samples were taken 4 days after administration of BPL-inactivated Udorn/72 to the middle ear. MEC, middle ear cavity; Co, cochlea. (B) Replication of Udorn/72 and Udorn-PR8 HA in the nasal cavity of mice various days post-IAV infection. (C) Replication of Udorn/72 and Udorn-PR8 HA strains in the middle ears of mice various days post-IAV infection. Viral titers are represented as the averages of titers derived from the left and right ears of each mouse. (D) Genomic viral RNA (vRNA) detected by qPCR in the middle ear 6 days post-IAV infection. Copy number (nr) is expressed per 3.5 μg of RNA. (E) Viral mRNA detected by qPCR in the middle ear 6 days post-IAV infection. Copy number is expressed per 5 μg of RNA. Statistical significance was determined using a Mann-Whitney U test and is denoted by three asterisks (P < 0.001) or two asterisks (P < 0.01). Data are pooled from a minimum of two independent experiments, and a dashed line indicates the detection limit of the assay.
Fig 5
Fig 5
The HA mediates infection and inflammation in HMEECs. (A) Percentages of HMEECs infected by different IAV strains 8 h postinfection at an MOI of 1. (B) IL-6 levels in the cell supernatant of HMEECs 20 h postinfection with IAV (MOI of 1) or post-mock infection. (C) IL-8 levels in the cell supernatant of HMEECs 20 h postinfection with IAV (MOI of 1) or post-infection. Statistical significance was determined using a Mann-Whitney U test, and significance is denoted by one asterisk (P < 0.05). Data are pooled from three independent experiments, and data represent the means ± SEM. (D) Percentages of HMEECs infected by recently circulating clinical IAV strains 8 h postinfection at an MOI of 1. Statistical significance was determined using a one-way ANOVA and Dunnett's posttest and was analyzed relative to mock-treated cells. Data are pooled from three independent experiments, and data represent the means ± SEM.

Comment in

References

    1. Adegbola R, Obaro S, Biney E, Greenwood B. 2001. Evaluation of Binax NOW Streptococcus pneumoniae urinary antigen test in children in a community with a high carriage rate of pneumococcus. Pediatr. Infect. Dis. J. 20:718–719 - PubMed
    1. Kadioglu A, Weiser JN, Paton JC, Andrew PW. 2008. The role of Streptococcus pneumoniae virulence factors in host respiratory colonization and disease. Nat. Rev. Microbiol. 6:288–301 - PubMed
    1. Coates D, Sweet C, Smith H. 1986. Severity of fever in influenza: differential pyrogenicity in ferrets exhibited by H1N1 and H3N2 strains of differing virulence. J. Gen. Virol. 67:419–425 - PubMed
    1. Peltola VT, McCullers JA. 2004. Respiratory viruses predisposing to bacterial infections: role of neuraminidase. Pediatr. Infect. Dis. J. 23:S87–S97 - PubMed
    1. Peltola VT, Murti KG, McCullers JA. 2005. Influenza virus neuraminidase contributes to secondary bacterial pneumonia. J. Infect. Dis. 192:249–257 - PMC - PubMed

Publication types

MeSH terms