. 2013 Feb 26;110(9):3549-54.
doi: 10.1073/pnas.1214912110. Epub 2013 Jan 14.

Cortical energy demands of signaling and nonsignaling components in brain are conserved across mammalian species and activity levels

Affiliations

Cortical energy demands of signaling and nonsignaling components in brain are conserved across mammalian species and activity levels

Fahmeed Hyder et al. Proc Natl Acad Sci U S A. .

Abstract

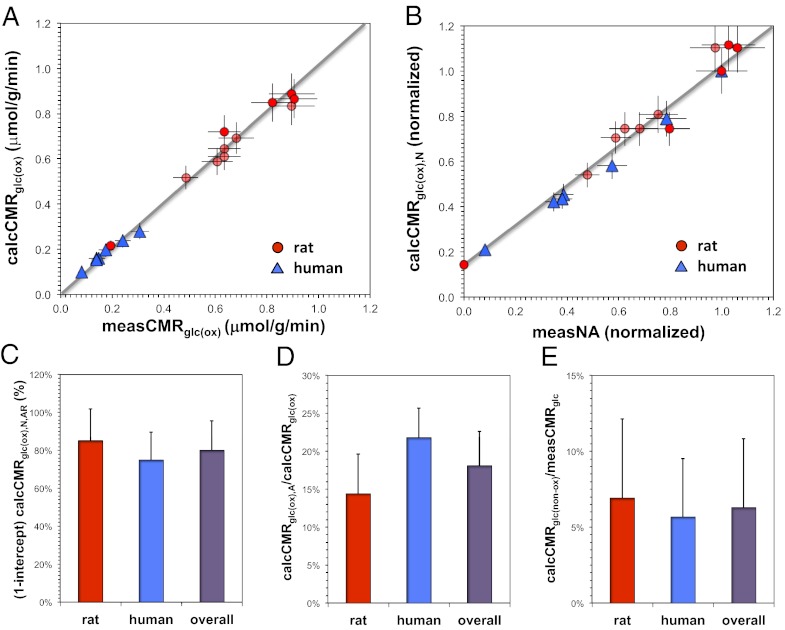
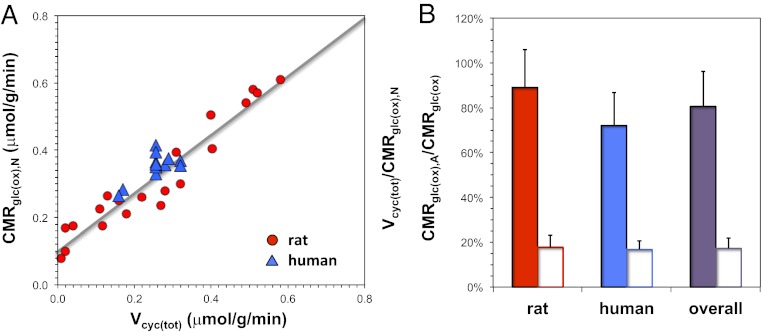
The continuous need for ion gradient restoration across the cell membrane, a prerequisite for synaptic transmission and conduction, is believed to be a major factor for brain's high oxidative demand. However, do energy requirements of signaling and nonsignaling components of cortical neurons and astrocytes vary with activity levels and across species? We derived oxidative ATP demand associated with signaling (P(s)) and nonsignaling (P(ns)) components in the cerebral cortex using species-specific physiologic and anatomic data. In rat, we calculated glucose oxidation rates from layer-specific neuronal activity measured across different states, spanning from isoelectricity to awake and sensory stimulation. We then compared these calculated glucose oxidation rates with measured glucose metabolic data for the same states as reported by 2-deoxy-glucose autoradiography. Fixed values for P(s) and P(ns) were able to predict the entire range of states in the rat. We then calculated glucose oxidation rates from human EEG data acquired under various conditions using fixed P(s) and P(ns) values derived for the rat. These calculated metabolic data in human cerebral cortex compared well with glucose metabolism measured by PET. Independent of species, linear relationship was established between neuronal activity and neuronal oxidative demand beyond isoelectricity. Cortical signaling requirements dominated energy demand in the awake state, whereas nonsignaling requirements were ∼20% of awake value. These predictions are supported by (13)C magnetic resonance spectroscopy results. We conclude that mitochondrial energy support for signaling and nonsignaling components in cerebral cortex are conserved across activity levels in mammalian species.


Conflict of interest statement

The authors declare no conflict of interest.

Figures

Fig. 1.
Fig. 1.
Relationship between glucose oxidation [CMRglc(ox)] and neuronal activity as a function of OGI. (A) Comparison between calculated CMRglc(ox) [calcCMRglc(ox)] and measured CMRglc(ox) [measCMRglc(ox)] values. Values of measCMRglc(ox) were derived from 2DG autoradiography in rat brain and PET in human brain, whereas values of calcCMRglc(ox) were derived for an OGI of 5.6. The goodness of fit between measCMRglc(ox) and calcCMRglc(ox) for the rat data (red circles) is indicated by the gray line with an R2 value of 0.96 (σ2 = 0.0182 for 11 states). The human data (blue triangles) also showed a strong correlation (R2 = 0.91 and σ2 = 0.0023 for seven states). (B) Comparison between measured NA (measNA) and calculated glucose oxidation in neurons [calcCMRglc(ox),N] in rat (red circles) and human (blue triangles) brains shows good correlation [R2 = 0.98, where calcCMRglc(ox),N = 0.90measNA + 0.12]. Because the data were normalized to the awake resting state values, the intercept on the vertical axis is about ∼20% of calcCMRglc(ox),N in the awake state for both species. (C–E) Comparison of calculated total glucose oxidation [calcCMRglc(ox)], calculated glucose oxidation in neurons [calcCMRglc(ox),N], calculated glucose oxidation in astrocytes [calcCMRglc(ox),A], calculated nonoxidative glucose consumption [calcCMRglc(nonox)], and measured total glucose consumption (measCMRglc), where calcCMRglc(ox) = calcCMRglc(ox),N + calcCMRglc(ox),A and calcCMRglc(nonox) = measCMRglc − calcCMRglc(ox). Ratios in rat brain (red), human brain (blue), and overall (purple) for (C) the value of the calcCMRglc(ox),N in B for the nonanesthetized awake resting state [calcCMRglc(ox),N,AR] minus the value of the intercept [i.e., (1-intercept)calcCMRglc(ox),N,AR] and the values of (D) calcCMRglc(ox),A/calcCMRglc(ox) and (E) calcCMRglc(nonox)/measCMRglc measured across all activity levels. All error bars indicate SDs from the mean. All calculations were obtained with Ps = 4.81 × 10⁹ ATP/spike per neuron, Pns,N = 9.20 × 10⁸ ATP/neuron per second, and Pns,A = 6.85 × 10⁸ ATP/astrocytes per second). Details are in Tables 1, 2, and 3.
Fig. 2.
Fig. 2.
In vivo 13C MRS experiments reporting rates of neurotransmitter cycling [Vcyc(tot)] and glucose oxidation in neurons [CMRglc(ox),N] and astrocytes [CMRglc(ox),A]. (A) Values of Vcyc(tot) and CMRglc(ox),N for rat (red circles) and human (blue triangles) cerebral cortex. The rat data represented many activity levels in the somatosensory cortex, whereas the human data were from the awake resting state in the visual cortex with varying degrees of gray vs. white matter partial volume (Table S3). Linear trends between changes in Vcyc(tot) and CMRglc(ox),N suggest strong coupling between neurotransmitter activity and energy metabolism [R2 = 0.92, where CMRglc(ox),N = 0.87 Vcyc(tot) + 0.10], where the finite intercept ranging between 0.05 and 0.15 μmol/g per minute indicates energy consumption for nonsignaling conditions. (B) Ratios of Vcyc(tot)/CMRglc(ox),N in the nonanesthetized awake resting state (filled bars) (Table S3) and CMRglc(ox),A/CMRglc(ox) for all conditions above isoelectricity (open bars) (Table S4) in rat (red), human (blue), and overall (purple). Similarity between the Vcyc(tot)/CMRglc(ox),N ratios (filled bars) in rat and human suggests that the relationship between Vcyc(tot) and CMRglc(ox),N in both species may be conserved. Likewise, correspondence between the CMRglc(ox),A/CMRglc(ox) ratios (open bars) suggests that the relationship between CMRglc(ox),A and CMRglc(ox) across species could be similar.

Comment in

  • Allometry of brain metabolism.
    Balaban RS. Balaban RS. Proc Natl Acad Sci U S A. 2013 Feb 26;110(9):3216-7. doi: 10.1073/pnas.1221313110. Epub 2013 Feb 13. Proc Natl Acad Sci U S A. 2013. PMID: 23407170 Free PMC article. No abstract available.

References

    1. Aiello LC, Wheeler P. The expensive-tissue hypothesis—the brain and the digestive-system in human and primate evolution. Curr Anthropol. 1995;36(2):199–221.
    1. Sibson NR, et al. Stoichiometric coupling of brain glucose metabolism and glutamatergic neuronal activity. Proc Natl Acad Sci USA. 1998;95(1):316–321. - PMC - PubMed
    1. Hyder F, et al. Neuronal-glial glucose oxidation and glutamatergic-GABAergic function. J Cereb Blood Flow Metab. 2006;26(7):865–877. - PubMed
    1. Smith AJ, et al. Cerebral energetics and spiking frequency: The neurophysiological basis of fMRI. Proc Natl Acad Sci USA. 2002;99(16):10765–10770. - PMC - PubMed
    1. Maandag NJ, et al. Energetics of neuronal signaling and fMRI activity. Proc Natl Acad Sci USA. 2007;104(51):20546–20551. - PMC - PubMed

Publication types

MeSH terms

LinkOut - more resources