. 2013 Jan 29;110(5):E435-44.
doi: 10.1073/pnas.1222061110. Epub 2013 Jan 14.

Comprehensive developmental profiles of gene activity in regions and subregions of the Arabidopsis seed

Affiliations

Comprehensive developmental profiles of gene activity in regions and subregions of the Arabidopsis seed

Mark F Belmonte et al. Proc Natl Acad Sci U S A. .

Abstract

Seeds are complex structures that consist of the embryo, endosperm, and seed-coat regions that are of different ontogenetic origins, and each region can be further divided into morphologically distinct subregions. Despite the importance of seeds for food, fiber, and fuel globally, little is known of the cellular processes that characterize each subregion or how these processes are integrated to permit the coordinated development of the seed. We profiled gene activity genome-wide in every organ, tissue, and cell type of Arabidopsis seeds from fertilization through maturity. The resulting mRNA datasets offer the most comprehensive description of gene activity in seeds with high spatial and temporal resolution,providing unique insights into the function of understudied seed regions. Global comparisons of mRNA populations reveal unexpected overlaps in the functional identities of seed subregions. Analyses of coexpressed gene sets suggest that processes that regulate seed size and filling are coordinated across several subregions. Predictions of gene regulatory networks based on the association of transcription factors with enriched DNA sequence motifs upstream of coexpressed genes identify regulators of seed development. These studies emphasize the utility of these data sets as an essential resource for the study of seed biology.


Conflict of interest statement

The authors declare no conflict of interest.

Figures

Fig. 1.
Fig. 1.
Gene activity in Arabidopsis seed regions and subregions throughout Development. (A–F) Representation of Arabidopsis seeds at the (A) preglobular stage, (B) globular stage, (C) heart stage, (D) linear cotyledon stage, and (E) mature green stage. (F) Diagram of a seed showing micropylar (MP) and chalazal (CZ) poles. (G) Number of distinct mRNAs detected in seed subregions (colored bars), regions, and seeds (light gray bars) at different stages. Dark gray bars indicate the number of distinct transcription factor mRNAs. Lists of mRNAs and their levels are in Dataset S2. (H) Number of distinct mRNAs that accumulate specifically in a subregion or region at a given stage. Subregion and region-specific mRNAs are listed in Dataset S3. (I) Number of distinct mRNAs that accumulate at a specific stage in a subregion or region. Stage-specific mRNAs are listed in Dataset S3. Abbreviations are given in Table 1.
Fig. 2.
Fig. 2.
PCA of seed subregion mRNA populations. PCA plot shows four distinct groups of subregion mRNA populations: subregions of the seed coat region at all stages (blue), EP, SUS, MCE, and PEN subregions at early stages (green), CZE subregions at early stages (yellow), and the EP and all endosperm subregions at the maturation phase (red). Principal components one through three collectively represent 55.6% of the variance in the dataset. Abbreviations are given in Table 1.
Fig. 3.
Fig. 3.
Dominant patterns of gene expression during seed development. (A) Forty-seven DPs were identified using Fuzzy K means clustering of the 50% most variant mRNAs in all seed subregions and stages. Bar graphs depict median mRNA levels in each subregion (colored bars) at each stage (left to right, preglobular to mature-green stage). DPs representing the indicated stage-specific, subregion-specific, region-specific, and CZE-delayed coexpressed gene sets are shown. Remaining DPs are shown in Fig. S4, and mRNAs in all DPs are listed in Dataset S4. The average number of mRNAs in each DP gene set was 103. (B) Heat map of conceptualized CZE-delayed mRNA accumulation patterns in embryo and endosperm subregions. mRNA accumulation in seed coat subregions is not shown.
Fig. 4.
Fig. 4.
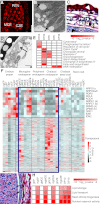
Functions of subregion-specific genes. (A) Heat map showing the P value significance of enrichment of GO terms () or metabolic pathways (*) for subregion-specific mRNAs (Dataset S3). The listed GO terms are for biological processes or cellular components and metabolic pathways that were overrepresented at two or more stages and/or for the DP gene set that exhibit subregion specificity. (B) Histochemical staining of starch granules (arrowheads) in the suspensor. (Scale bar, 3 µm.) (Inset) The location of the enlarged area relative to the embryo proper and suspensor. (C–E) Relative mRNA levels determined in GeneChip experiments (bar plots) and qRT-PCR experiments (line plots) for the indicated genes involved in (C) auxin biosynthesis, (D) auxin response, and (E) polar auxin transport.
Fig. 5.
Fig. 5.
CZE is a unique seed subregion developmentally. (A) Hierachical clustering of seed-specific mRNAs. The largest number of seed-specific mRNAs accumulate primarily in the CZE. (B) Heat map depicting relative levels of mRNAs encoding rate-limiting enzymes for gibberellic acid (GA; GA3ox), abscisic acid (ABA; NCED), and cytokinin (CK; IPT) biosynthesis.
Fig. 6.
Fig. 6.
Functions of CZE-delayed coexpressed gene sets. (A) Autofluorescent chloroplasts in the endosperm of a globular-stage seed. (B) Transmission electron microscopy of chloroplasts (arrows) in the PEN. (C) Histochemical staining of starch granules (arrowheads) in the SC, PEN, and EP. (D) Transmission electron micrograph of oil bodies (arrows) in cellularized PEN. (E) Heat map showing P value significance of enrichment of selected GO terms () or metabolic pathways (*) associated with the indicated CZE-delayed gene sets. (F) Heat maps showing mRNAs involved in the RNA-dependent DNA methylation pathway (Upper) and 1,155 probesets corresponding to transposons (Lower) (21). (G) Detection of protein bodies (PB) in the EP and PEN. (H) Heat map showing P values for GO-term enrichment of mature-green stage-specific mRNAs and the indicated DPs at the globular and mature-green stages. (Scale bars: 25 µm in A, 0.5 µm in B, 10 µm in C, 3 µm in D, and 10 µm in G.)
Fig. 7.
Fig. 7.
Predicted transcriptional modules regulating maturation in seeds. DNA motifs (green triangles) and GO terms (blue parallelogram) that are significantly overrepresented (P < 0.001, hypergeometric distribution) within the coexpressed gene set (open squircle). Coexpressed transcription factors are represented as circles. Transcriptional modules were predicted for mature-green stage-specific genes in the (A) EP, (B) MCE, (C) CZE, and (D) PEN, and for (E) DP 12. All four mature green-stage subregions possess transcriptional modules in which bZIP transcription factors known to regulate maturation genes such as bZIP67 (AT3G44460), EEL (AT2G41070), or ABI5 (AT2G36270) are associated with overrepresented G box-like DNA motifs such as ABRE and DPBF1 and -2. Edges in red indicate known interactions between transcription factors and DNA motifs, whereas dashed lines represent predicted interactions. All enriched DNA motifs and GO terms are listed in Dataset S1, Table S6.

References

    1. Steeves TA. The evolution and biological significance of seeds. Can J Bot. 1983;61(12):3550–3560.
    1. Godfray HCJ, et al. Food security: The challenge of feeding 9 billion people. Science. 2010;327(5967):812–818. - PubMed
    1. Ohto M, Stone SL, Harada JJ. Genetic control of seed development and seed mass. In: Bradford KJ, Nonogaki H, editors. Seed Development, Dormancy, and Germination. Oxford: Blackwell; 2007. pp. 1–24.
    1. Brown RC, Lemmon BE, Nguyen H, Olsen O-A. Development of endosperm in Arabidopsis thaliana. Sex Plant Reprod. 1999;12(1):32–42.
    1. Le BH, et al. Global analysis of gene activity during Arabidopsis seed development and identification of seed-specific transcription factors. Proc Natl Acad Sci USA. 2010;107(18):8063–8070. - PMC - PubMed

Publication types

MeSH terms

Substances

Associated data