. 2013 Feb 11;210(2):389-99.
doi: 10.1084/jem.20121970. Epub 2013 Jan 14.

Atypical and classical memory B cells produce Plasmodium falciparum neutralizing antibodies

Affiliations

Atypical and classical memory B cells produce Plasmodium falciparum neutralizing antibodies

Matthias F Muellenbeck et al. J Exp Med. .

Abstract

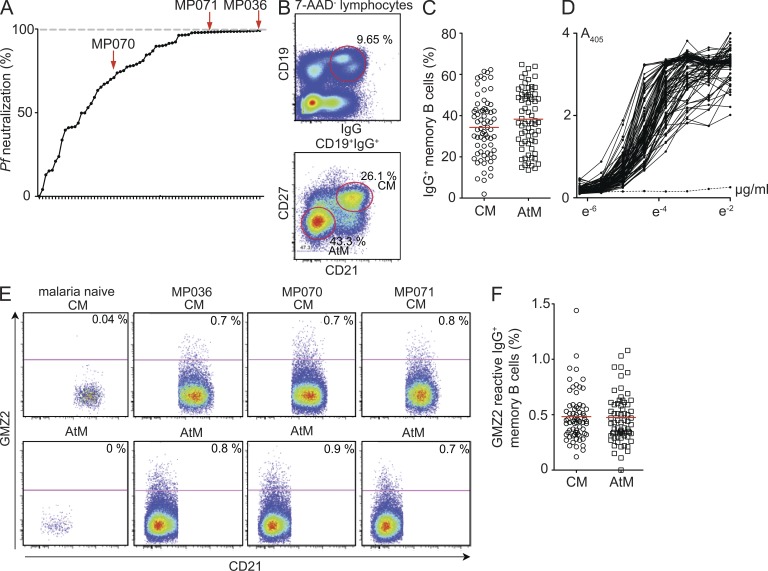
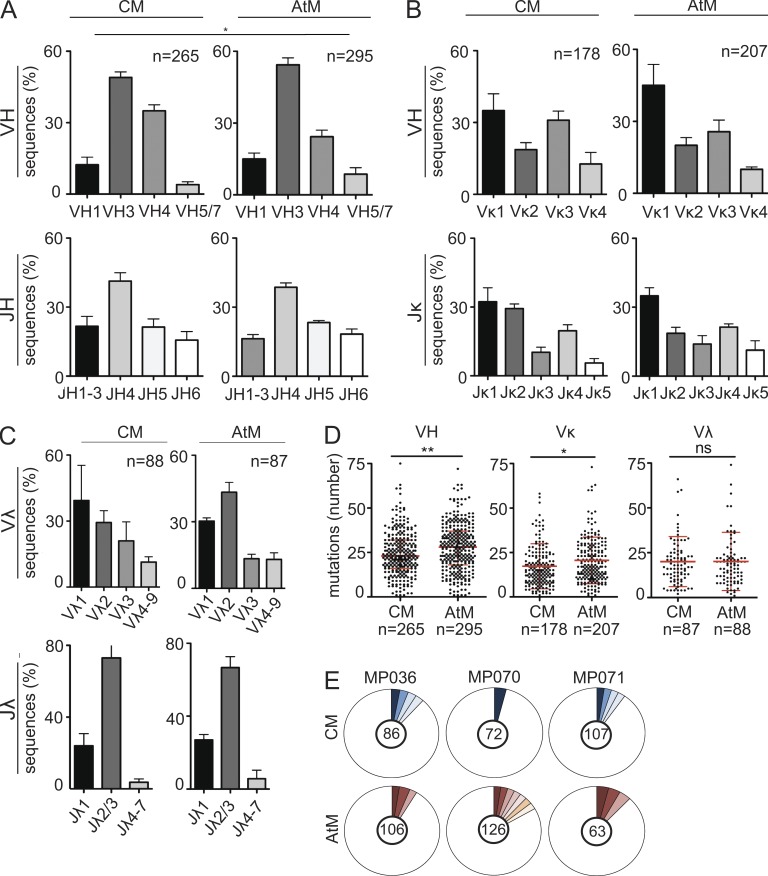
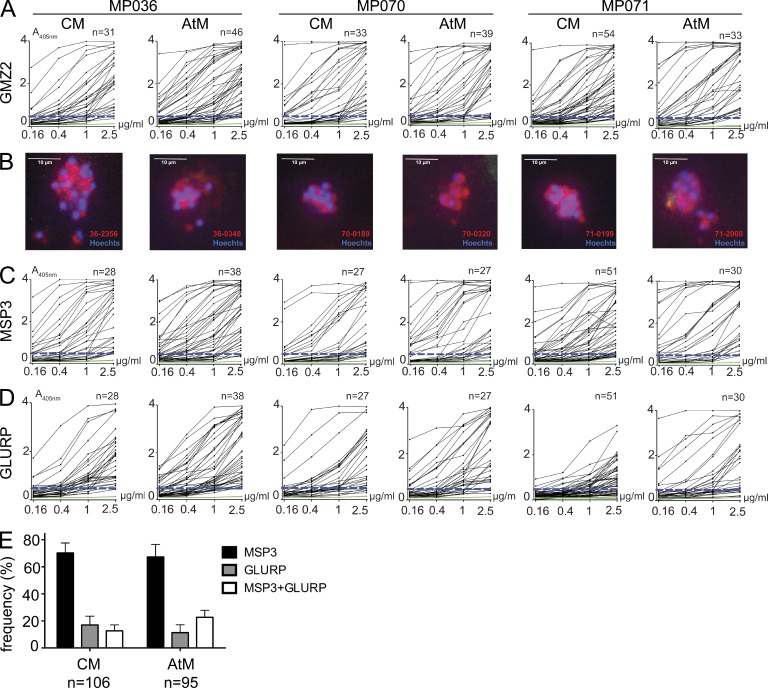
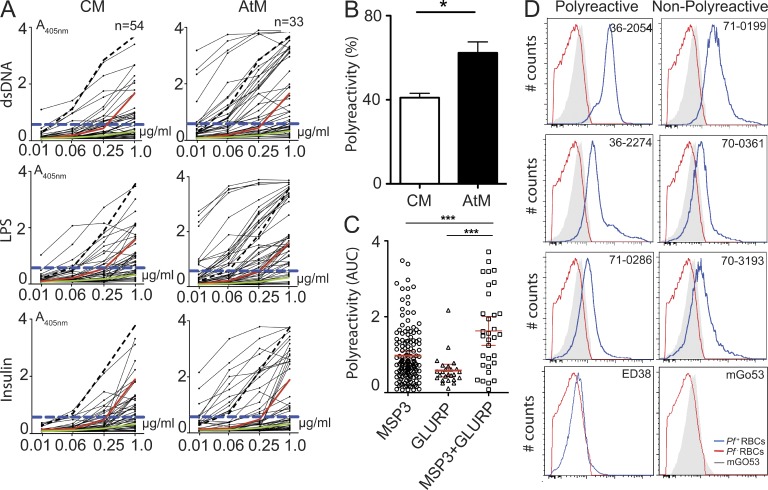
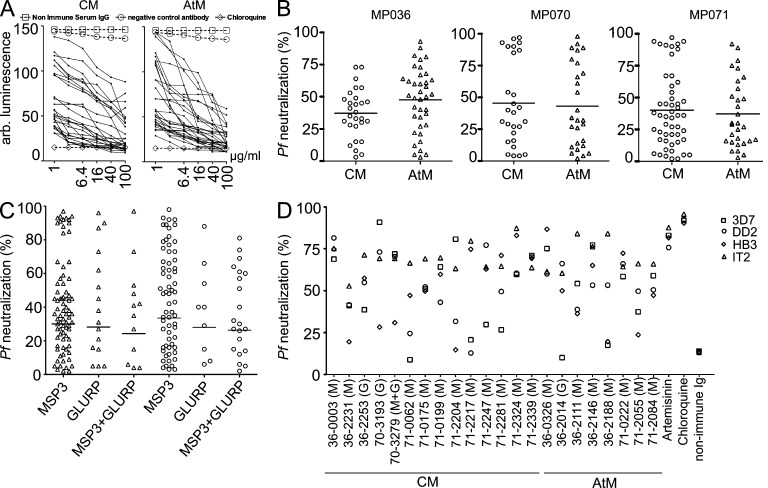
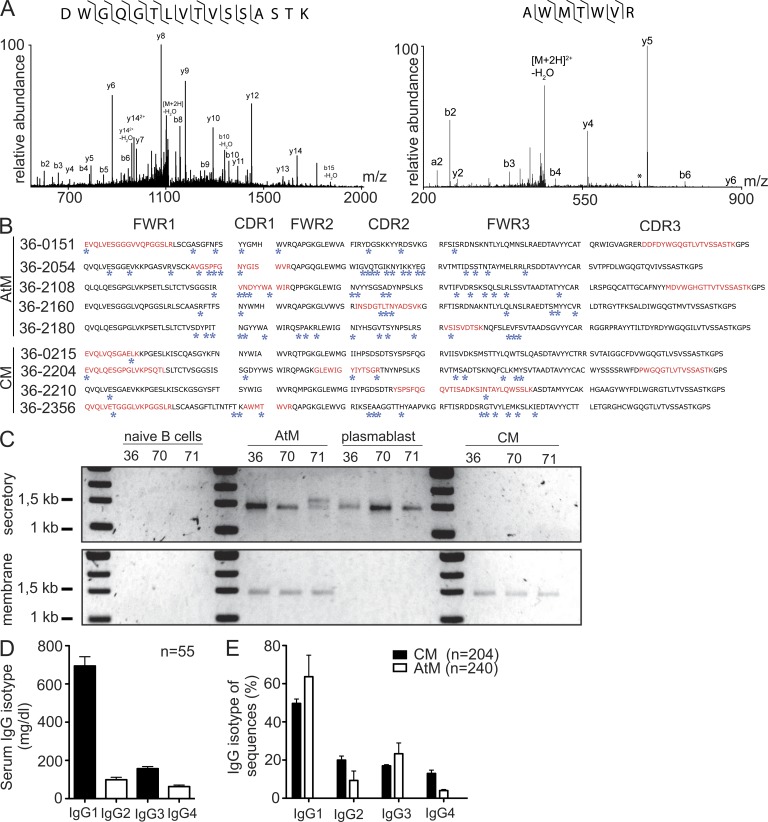
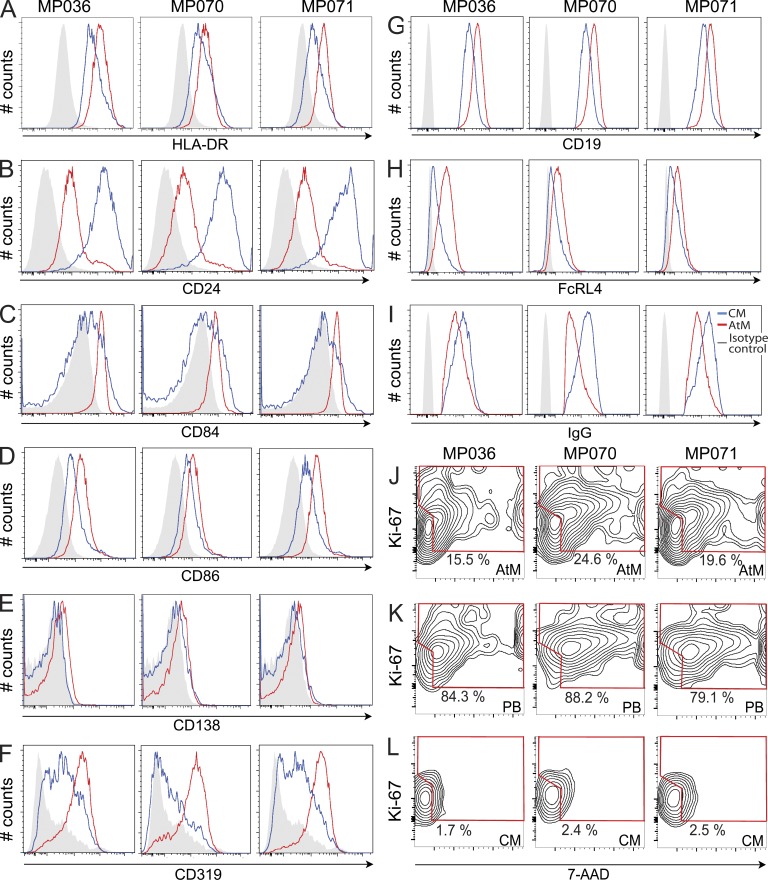
Antibodies can protect from Plasmodium falciparum (Pf) infection and clinical malaria disease. However, in the absence of constant reexposure, serum immunoglobulin (Ig) levels rapidly decline and full protection from clinical symptoms is lost, suggesting that B cell memory is functionally impaired. We show at the single cell level that natural Pf infection induces the development of classical memory B cells (CM) and atypical memory B cells (AtM) that produce broadly neutralizing antibodies against blood stage Pf parasites. CM and AtM contribute to anti-Pf serum IgG production, but only AtM show signs of active antibody secretion. AtM and CM were also different in their IgG gene repertoire, suggesting that they develop from different precursors. The findings provide direct evidence that natural Pf infection leads to the development of protective memory B cell antibody responses and suggest that constant immune activation rather than impaired memory function leads to the accumulation of AtM in malaria. Understanding the memory B cell response to natural Pf infection may be key to the development of a malaria vaccine that induces long-lived protection.


Figures

Figure 1.
Figure 1.
Memory B cell sorting. (A) Relative 3D7Luc neutralizing activity of 100 µg/ml purified serum IgG from study participants in comparison to polyclonal serum IgG preparations from nonimmune controls (0% neutralization) and 50 mM chloroquine (100% neutralization, dashed gray line). Dots represent individual samples. Selected donors for antibody cloning are indicated. (B) Gating strategy for the flow cytometric isolation of CM and AtM. Representative plots from MP070 are shown. (C) Frequency of circulating CM and AtM. (D) IgG GMZ2 reactivity in serum as measured by ELISA. The dotted line shows a Pf-naive control serum. (E) Flow cytometric analysis of GMZ2-reactive CM and AtM in peripheral blood from MP036, MP070, and MP071 compared with a malaria naive donor. (F) Frequency of circulating GMZ2-reactive CM and AtM in all donors as determined in E. Red bars indicate arithmetic mean.
Figure 2.
Figure 2.
Antibody repertoire of CM and AtM. (A–C) IGHV and IGHJ (A), IGLVK and IGLJK (B), and IGLVL and IGLJL (C) gene family usage. The numbers of sequences analyzed are indicated. P-values were calculated using Fisher’s exact test. (D) Absolute number of V segment somatic hypermutations. Geometric means with SD and the absolute numbers of sequences analyzed are indicated. P-values were determined using Student’s t test. (E) Shaded pie areas indicate clonally expanded CM and AtM. Absolute numbers of sequences analyzed are indicated.
Figure 3.
Figure 3.
Anti-Pf CM and AtM antibody reactivity. (A) GMZ2 ELISA reactivity. The dashed blue line indicates the threshold OD405nm for positive reactivity. The green line represents the negative control antibody mGO53 (Wardemann et al., 2003). n indicates the numbers of tested antibodies. (B) Antibody reactivity (red) with Pf schizonts (blue) in iRBCs as measured by indirect immunofluorescence (bars, 10 µm). (C and D) ELISA reactivity of GMZ2-reactive antibodies (A) with MSP3 (C) and GLURP (D). (E) Bars summarize the mean frequency of MSP3, GLURP, and MSP3+GLURP reactive antibodies in all three donors (error bars indicate SEM).
Figure 4.
Figure 4.
CM and AtM antibody polyreactivity. (A) ELISA reactivity with dsDNA, LPS, and insulin of CM and AtM antibodies from MP071. Non-polyreactive (green line; mGO53) and low (red line, JB40) and high (black dashed line, ED38) polyreactive control antibodies are shown. Dashed blue line indicates reactivity threshold. (B) Frequency of polyreactive CM and AtM antibodies from MP036, MP070, and MP071. (C) Symbols indicate antibody polyreactivity as the mean area under curve (AUC) for reactivity with dsDNA, insulin, and LPS. Horizontal lines indicate mean levels of antibody polyreactivity in all three donors. Error bars indicate SEM, and P-values were calculated using the ANOVA test. (D) Histograms show reactivity with noninfected Hoechst-negative RBCs (red line) and Hoechst-positive Pf-infected iRBCs (blue line) for representative polyreactive and nonpolyreactive anti-MSP3, anti-GLURP, and anti-MSP3+GLURP antibodies as determined by flow cytometry. Polyreactive (ED38) and nonpolyreactive (mGO53) control antibodies from malaria naive controls are shown. Gray areas show the iRBC reactivity of the non Pf-reactive isotype control antibody mGO53 in each plot. Data shown are representative for two independent experiments.
Figure 5.
Figure 5.
Pf merozoite neutralizing activity of CM and AtM antibodies. (A) 3D7Luc transgenic parasite growth in the presence of individual antibodies (black lines; MP070) or the indicated controls. (B) Relative 3D7Luc neutralizing activity of GMZ2-reactive antibodies at 6.4 µg/ml. Horizontal lines indicate mean neutralizing activity. (C) 3D7Luc neutralizing activity of individual MSP3, GLURP, and polyreactive CM and AtM antibodies as in B. Black bars indicate geometric mean. (D) Relative Pf 3D7, HB3 (Honduras), DD2 (Thailand), and IT4 (Brazil) neutralizing activity of GMZ2-reactive antibodies at 100 µg/ml compared with chloroquine (100%). Parasites were detected using SYBR green. Data shown are representative of at least two independent experiments.
Figure 6.
Figure 6.
CM and AtM contribution to anti-Pf serum IgG. (A) Representative MS/MS spectra. Observed b-type fragment ions (containing the N terminus), y-type fragment ions (containing the C terminus), and loss of water (*) are indicated. Ions corresponding to the loss of water are labeled. Observed backbone cleavages are indicated (⌉ for b-type ions, ⌊ for y-type ions). Data shown are representative of at least three independent experiments on two different instruments. (B) IgH amino acid sequences of CM and AtM antibodies. Framework regions (FWR) and complementarity determining regions (CDR) are indicated. Blue stars indicate somatic point mutations. Mass spectrometric peptides with identical amino acid sequence are indicated in red. (C) RT-PCR amplicons of secretory and membrane IgG transcripts from the indicated B cell subpopulations. Data shown are representative of at least two independent experiments. (D) Serum IgG subclass distribution in donors from the Lambaréné area. (E) IgG subclass distribution as determined by IGH gene transcript sequence analysis. n indicates the number of tested sera. Error bars indicate SD.
Figure 7.
Figure 7.
AtM express surface markers associated with B cell activation and show signs of recent cell divisions. Flow cytometric assessment of HLA-DR (A), CD24 (B), CD84 (C), CD86 (D), CD138 (E), CD319 (F), CD19 (G), FcRL4 (H), and surface IgG (I) surface expression levels on AtM (red line) and CM (blue line) from MP036, MP070, and MP071 in comparison to the isotype control (gray) are shown. Flow cytometric measurements of the DNA content and proliferation-associated Ki-67 protein expression levels in CD19+IgG+CD21CD27 AtM (J), CD19+IgG+CD21CD27+ circulating plasmablasts (PB; K), and CD19+IgG+CD21+CD27+CD38 CM (L) are also shown.

References

    1. Akpogheneta O.J., Duah N.O., Tetteh K.K., Dunyo S., Lanar D.E., Pinder M., Conway D.J. 2008. Duration of naturally acquired antibody responses to blood-stage Plasmodium falciparum is age dependent and antigen specific. Infect. Immun. 76:1748–1755 10.1128/IAI.01333-07 - DOI - PMC - PubMed
    1. Amanna I.J., Slifka M.K. 2010. Mechanisms that determine plasma cell lifespan and the duration of humoral immunity. Immunol. Rev. 236:125–138 10.1111/j.1600-065X.2010.00912.x - DOI - PMC - PubMed
    1. Amanna I.J., Carlson N.E., Slifka M.K. 2007. Duration of humoral immunity to common viral and vaccine antigens. N. Engl. J. Med. 357:1903–1915 10.1056/NEJMoa066092 - DOI - PubMed
    1. Bernasconi N.L., Traggiai E., Lanzavecchia A. 2002. Maintenance of serological memory by polyclonal activation of human memory B cells. Science. 298:2199–2202 10.1126/science.1076071 - DOI - PubMed
    1. Bouharoun-Tayoun H., Attanath P., Sabchareon A., Chongsuphajaisiddhi T., Druilhe P. 1990. Antibodies that protect humans against Plasmodium falciparum blood stages do not on their own inhibit parasite growth and invasion in vitro, but act in cooperation with monocytes. J. Exp. Med. 172:1633–1641 10.1084/jem.172.6.1633 - DOI - PMC - PubMed

Publication types

MeSH terms