

An adaptive framework for selecting environmental monitoring protocols to support ocean renewable energy development
- PMID: 23319884
- PMCID: PMC3540755
- DOI: 10.1100/2012/450685
An adaptive framework for selecting environmental monitoring protocols to support ocean renewable energy development
Abstract
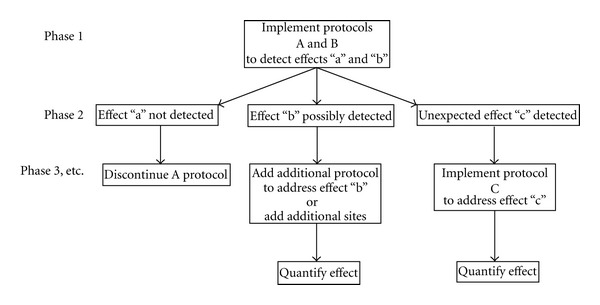
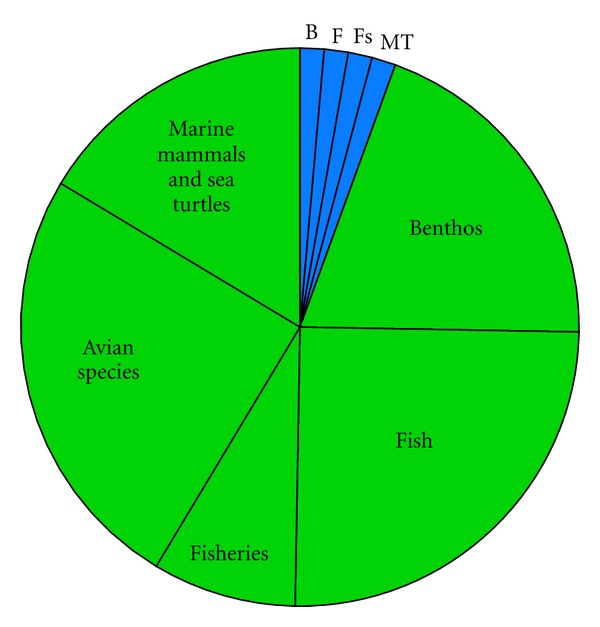
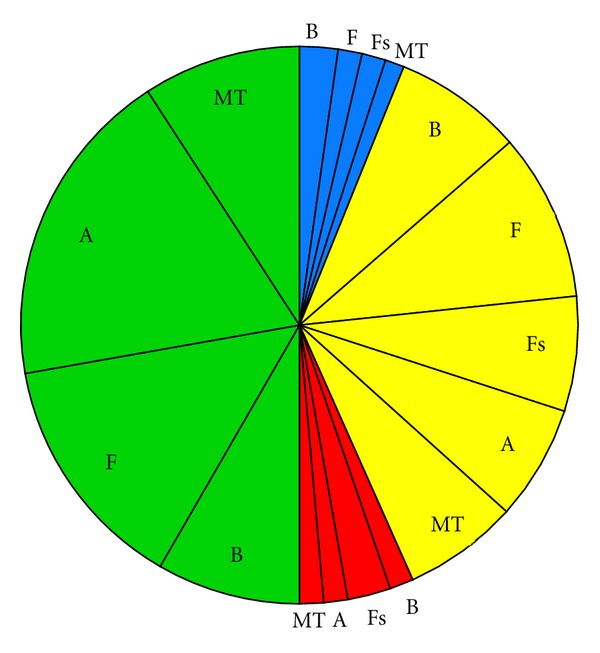
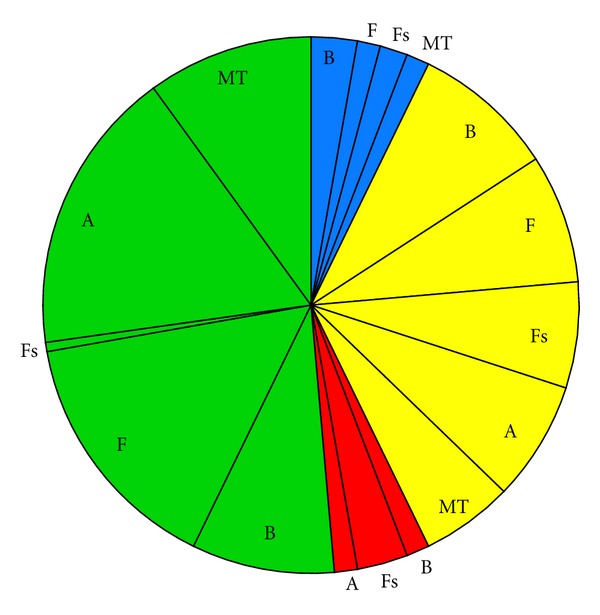
Offshore renewable energy developments (OREDs) are projected to become common in the United States over the next two decades. There are both a need and an opportunity to guide efforts to identify and track impacts to the marine ecosystem resulting from these installations. A monitoring framework and standardized protocols that can be applied to multiple types of ORED would streamline scientific study, management, and permitting at these sites. We propose an adaptive and reactive framework based on indicators of the likely changes to the marine ecosystem due to ORED. We developed decision trees to identify suites of impacts at two scales (demonstration and commercial) depending on energy (wind, tidal, and wave), structure (e.g., turbine), and foundation type (e.g., monopile). Impacts were categorized by ecosystem component (benthic habitat and resources, fish and fisheries, avian species, marine mammals, and sea turtles) and monitoring objectives were developed for each. We present a case study at a commercial-scale wind farm and develop a monitoring plan for this development that addresses both local and national environmental concerns. In addition, framework has provided a starting point for identifying global research needs and objectives for understanding of the potential effects of ORED on the marine environment.
Figures
References
-
- Boehlert GW, Gill AB. Environmental and ecological effects of ocean renewable energy development. Oceanography. 2010;23(2):68–81.
-
- Inger R, Attrill MJ, Bearhop S, et al. Marine renewable energy: potential benefits to biodiversity? An urgent call for research. Journal of Applied Ecology. 2009;46(6):1145–1153.
-
- Gill AB. Offshore renewable energy: ecological implications of generating electricity in the coastal zone. Journal of Applied Ecology. 2005;42(4):605–615.
-
- ICES (International Council for the Exploration of the Sea) Report of the workshop on effects of offshore windfarms on marine benthos—facilitating a closer international collaboration throughout the North Atlantic region (WKEOMB); March 2012; Bremerhaven, Germany.
-
- BOEM (U.S. Bureau of Ocean Energy Management) BOEM Environmental Studies Program—Studies Development Plan FY, 2013-2015. Washington, DC, USA: U.S. Department of the Interior; 2012.
Publication types
MeSH terms
LinkOut - more resources
Full Text Sources
