

The brain microvascular endothelium supports T cell proliferation and has potential for alloantigen presentation
- PMID: 23320074
- PMCID: PMC3540051
- DOI: 10.1371/journal.pone.0052586
The brain microvascular endothelium supports T cell proliferation and has potential for alloantigen presentation
Erratum in
- PLoS One. 2013;8(4). doi:10.1371/annotation/971919c7-d831-4c8c-9dbf-3ad7b2c1f667
Abstract
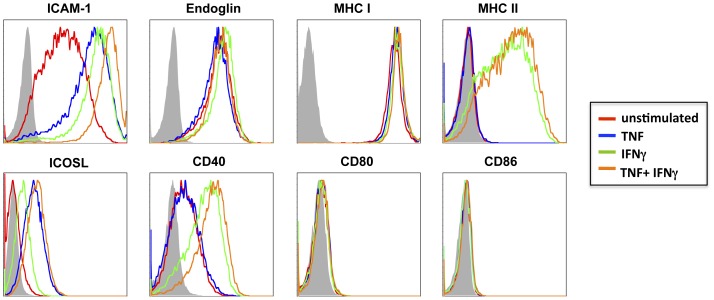
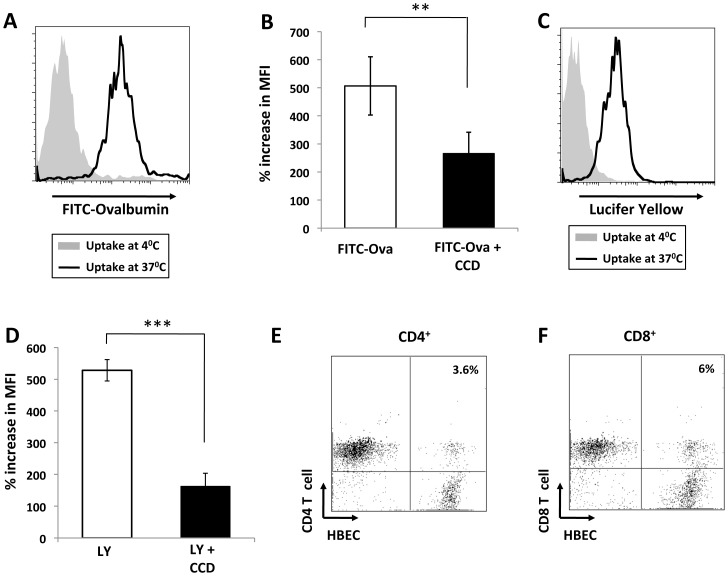
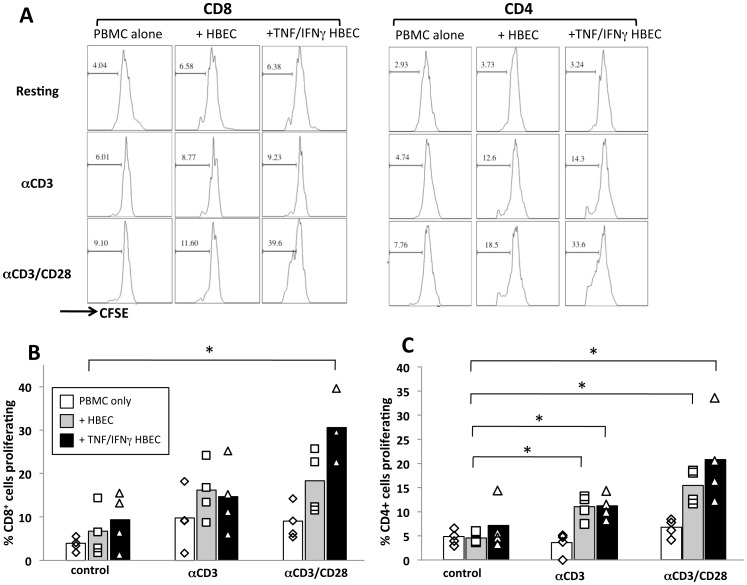
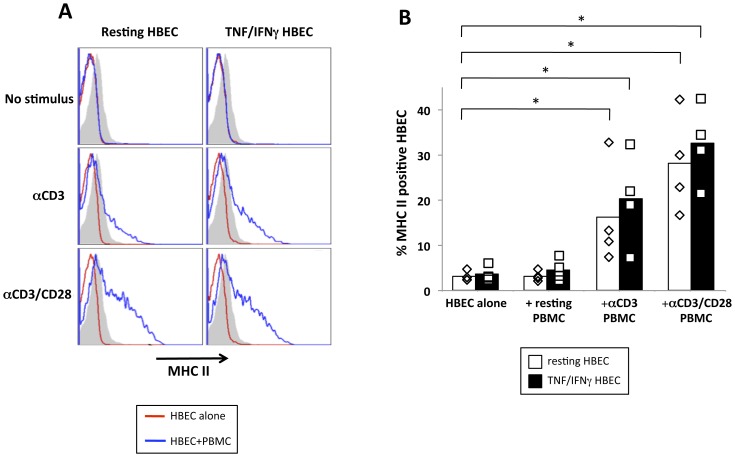
Endothelial cells (EC) form the inner lining of blood vessels and are positioned between circulating lymphocytes and tissues. Hypotheses have formed that EC may act as antigen presenting cells based on the intimate interactions with T cells, which are seen in diseases like multiple sclerosis, cerebral malaria (CM) and viral neuropathologies. Here, we investigated how human brain microvascular EC (HBEC) interact with and support the proliferation of T cells. We found HBEC to express MHC II, CD40 and ICOSL, key molecules for antigen presentation and co-stimulation and to take up fluorescently labeled antigens via macropinocytosis. In co-cultures, we showed that HBEC support and promote the proliferation of CD4(+) and CD8(+) T cells, which both are key in CM pathogenesis, particularly following T cell receptor activation and co-stimulation. Our findings provide novel evidence that HBEC can trigger T cell activation, thereby providing a novel mechanism for neuroimmunological complications of infectious diseases.
Conflict of interest statement
Figures
Similar articles
-
Endothelial microparticles interact with and support the proliferation of T cells.J Immunol. 2014 Oct 1;193(7):3378-87. doi: 10.4049/jimmunol.1303431. Epub 2014 Sep 3. J Immunol. 2014. PMID: 25187656 Free PMC article. Clinical Trial.
-
Muscle fibres and cultured muscle cells express the B7.1/2-related inducible co-stimulatory molecule, ICOSL: implications for the pathogenesis of inflammatory myopathies.Brain. 2003 May;126(Pt 5):1026-35. doi: 10.1093/brain/awg114. Brain. 2003. PMID: 12690043
-
Antigen presentation and immune regulatory capacity of immature and mature-enriched antigen presenting (dendritic) cells derived from human bone marrow.Hum Immunol. 2004 Feb;65(2):93-103. doi: 10.1016/j.humimm.2003.11.002. Hum Immunol. 2004. PMID: 14969764
-
The role of T-cell-mediated mechanisms in virus infections of the nervous system.Curr Top Microbiol Immunol. 2001;253:219-45. doi: 10.1007/978-3-662-10356-2_11. Curr Top Microbiol Immunol. 2001. PMID: 11417137 Review.
-
Costimulatory molecules and autoimmune thyroid diseases.Autoimmunity. 2002 May;35(3):159-67. doi: 10.1080/08916930290013441. Autoimmunity. 2002. PMID: 12389640 Review.
Cited by
-
Drugs Modulating CD4+ T Cells Blood-Brain Barrier Interaction in Alzheimer's Disease.Pharmaceutics. 2020 Sep 16;12(9):880. doi: 10.3390/pharmaceutics12090880. Pharmaceutics. 2020. PMID: 32948022 Free PMC article. Review.
-
The CD40-CD40L Dyad in Experimental Autoimmune Encephalomyelitis and Multiple Sclerosis.Front Immunol. 2017 Dec 12;8:1791. doi: 10.3389/fimmu.2017.01791. eCollection 2017. Front Immunol. 2017. PMID: 29312317 Free PMC article. Review.
-
Autophagy Pathways in the Genesis of Plasmodium-Derived Microvesicles: A Double-Edged Sword?Life (Basel). 2022 Mar 12;12(3):415. doi: 10.3390/life12030415. Life (Basel). 2022. PMID: 35330166 Free PMC article.
-
Antigen recognition detains CD8+ T cells at the blood-brain barrier and contributes to its breakdown.Nat Commun. 2023 May 30;14(1):3106. doi: 10.1038/s41467-023-38703-2. Nat Commun. 2023. PMID: 37253744 Free PMC article.
-
Alpha Adrenergic Induction of Transport of Lysosomal Enzyme across the Blood-Brain Barrier.PLoS One. 2015 Nov 6;10(11):e0142347. doi: 10.1371/journal.pone.0142347. eCollection 2015. PLoS One. 2015. PMID: 26545208 Free PMC article.
References
-
- Banchereau J, Steinman RM (1998) Dendritic cells and the control of immunity. Nature 392: 245–252. - PubMed
-
- Hunt NH, Grau GE (2003) Cytokines: accelerators and brakes in the pathogenesis of cerebral malaria. Trends Immunol 24: 491–499. - PubMed
-
- Male D, Pryce G (1989) Induction of Ia molecules on brain endothelium is related to susceptibility to experimental allergic encephalomyelitis. J Neuroimmunol 21: 87–90. - PubMed
Publication types
MeSH terms
Substances
LinkOut - more resources
Full Text Sources
Other Literature Sources
Research Materials
Miscellaneous
